
User Manual
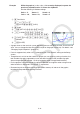
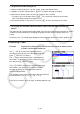
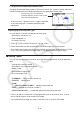
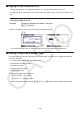
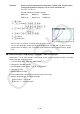
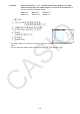


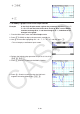
Table Of Contents
- Contents
- Getting Acquainted — Read This First!
- Chapter 1 Basic Operation
- Chapter 2 Manual Calculations
- 1. Basic Calculations
- 2. Special Functions
- 3. Specifying the Angle Unit and Display Format
- 4. Function Calculations
- 5. Numerical Calculations
- 6. Complex Number Calculations
- 7. Binary, Octal, Decimal, and Hexadecimal Calculations with Integers
- 8. Matrix Calculations
- 9. Vector Calculations
- 10. Metric Conversion Calculations
- Chapter 3 List Function
- Chapter 4 Equation Calculations
- Chapter 5 Graphing
- 1. Sample Graphs
- 2. Controlling What Appears on a Graph Screen
- 3. Drawing a Graph
- 4. Saving and Recalling Graph Screen Contents
- 5. Drawing Two Graphs on the Same Screen
- 6. Manual Graphing
- 7. Using Tables
- 8. Modifying a Graph
- 9. Dynamic Graphing
- 10. Graphing a Recursion Formula
- 11. Graphing a Conic Section
- 12. Drawing Dots, Lines, and Text on the Graph Screen (Sketch)
- 13. Function Analysis
- Chapter 6 Statistical Graphs and Calculations
- 1. Before Performing Statistical Calculations
- 2. Calculating and Graphing Single-Variable Statistical Data
- 3. Calculating and Graphing Paired-Variable Statistical Data (Curve Fitting)
- 4. Performing Statistical Calculations
- 5. Tests
- 6. Confidence Interval
- 7. Distribution
- 8. Input and Output Terms of Tests, Confidence Interval, and Distribution
- 9. Statistic Formula
- Chapter 7 Financial Calculation
- Chapter 8 Programming
- Chapter 9 Spreadsheet
- Chapter 10 eActivity
- Chapter 11 Memory Manager
- Chapter 12 System Manager
- Chapter 13 Data Communication
- Chapter 14 Geometry
- Chapter 15 Picture Plot
- Chapter 16 3D Graph Function
- Appendix
- Examination Mode
- E-CON4 Application (English)
- 1. E-CON4 Mode Overview
- 2. Sampling Screen
- 3. Auto Sensor Detection (CLAB Only)
- 4. Selecting a Sensor
- 5. Configuring the Sampling Setup
- 6. Performing Auto Sensor Calibration and Zero Adjustment
- 7. Using a Custom Probe
- 8. Using Setup Memory
- 9. Starting a Sampling Operation
- 10. Using Sample Data Memory
- 11. Using the Graph Analysis Tools to Graph Data
- 12. Graph Analysis Tool Graph Screen Operations
- 13. Calling E-CON4 Functions from an eActivity
5-34
u To generate a differential number table
Changing the setting of Setup screen’s “Derivative” item to “On” causes a number table that
includes the derivative to be displayed whenever you generate a number table.
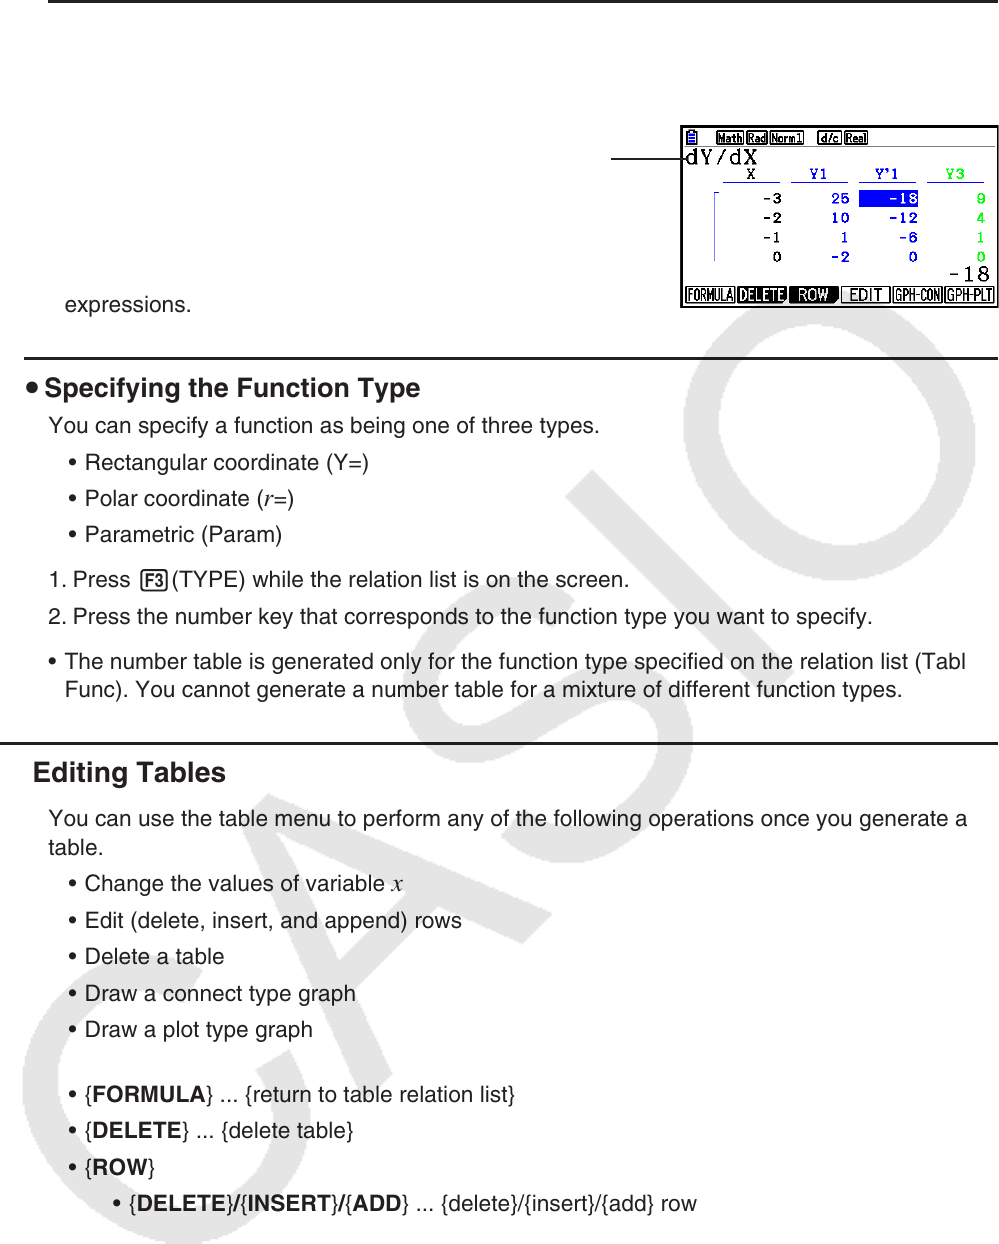
Locating the cursor at a differential
coefficient displays “dY/dX” in the top line,
which indicates differential.
• An error occurs if a graph for which a range is specified
or an overwrite graph is included among the graph
expressions.
u Specifying the Function Type
You can specify a function as being one of three types.
• Rectangular coordinate (Y=)
• Polar coordinate (
r =)
• Parametric (Param)
1. Press 3(TYPE) while the relation list is on the screen.
2. Press the number key that corresponds to the function type you want to specify.
• The number table is generated only for the function type specified on the relation list (Table
Func). You cannot generate a number table for a mixture of different function types.
k Editing Tables
You can use the table menu to perform any of the following operations once you generate a
table.
• Change the values of variable
x
• Edit (delete, insert, and append) rows
• Delete a table
• Draw a connect type graph
• Draw a plot type graph
• {FORMULA} ... {return to table relation list}
• {DELETE} ... {delete table}
• {ROW}
• {DELETE}/{INSERT}/{ADD} ... {delete}/{insert}/{add} row
• {EDIT} ... {change the values of variable
x}
• {GPH-CON}/{GPH-PLT} ... {connected type}/{draw plot type} graph draw
• If you try to replace a value with an illegal operation (such as division by zero), an error
occurs and the original value remains unchanged.
• You cannot directly change any values in the other (non-
x ) columns of the table.