
User Manual
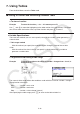
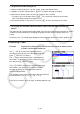
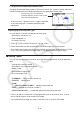
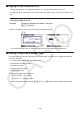
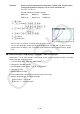
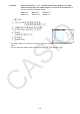


Table Of Contents
- Contents
- Getting Acquainted — Read This First!
- Chapter 1 Basic Operation
- Chapter 2 Manual Calculations
- 1. Basic Calculations
- 2. Special Functions
- 3. Specifying the Angle Unit and Display Format
- 4. Function Calculations
- 5. Numerical Calculations
- 6. Complex Number Calculations
- 7. Binary, Octal, Decimal, and Hexadecimal Calculations with Integers
- 8. Matrix Calculations
- 9. Vector Calculations
- 10. Metric Conversion Calculations
- Chapter 3 List Function
- Chapter 4 Equation Calculations
- Chapter 5 Graphing
- 1. Sample Graphs
- 2. Controlling What Appears on a Graph Screen
- 3. Drawing a Graph
- 4. Saving and Recalling Graph Screen Contents
- 5. Drawing Two Graphs on the Same Screen
- 6. Manual Graphing
- 7. Using Tables
- 8. Modifying a Graph
- 9. Dynamic Graphing
- 10. Graphing a Recursion Formula
- 11. Graphing a Conic Section
- 12. Drawing Dots, Lines, and Text on the Graph Screen (Sketch)
- 13. Function Analysis
- Chapter 6 Statistical Graphs and Calculations
- 1. Before Performing Statistical Calculations
- 2. Calculating and Graphing Single-Variable Statistical Data
- 3. Calculating and Graphing Paired-Variable Statistical Data (Curve Fitting)
- 4. Performing Statistical Calculations
- 5. Tests
- 6. Confidence Interval
- 7. Distribution
- 8. Input and Output Terms of Tests, Confidence Interval, and Distribution
- 9. Statistic Formula
- Chapter 7 Financial Calculation
- Chapter 8 Programming
- Chapter 9 Spreadsheet
- Chapter 10 eActivity
- Chapter 11 Memory Manager
- Chapter 12 System Manager
- Chapter 13 Data Communication
- Chapter 14 Geometry
- Chapter 15 Picture Plot
- Chapter 16 3D Graph Function
- Appendix
- Examination Mode
- E-CON4 Application (English)
- 1. E-CON4 Mode Overview
- 2. Sampling Screen
- 3. Auto Sensor Detection (CLAB Only)
- 4. Selecting a Sensor
- 5. Configuring the Sampling Setup
- 6. Performing Auto Sensor Calibration and Zero Adjustment
- 7. Using a Custom Probe
- 8. Using Setup Memory
- 9. Starting a Sampling Operation
- 10. Using Sample Data Memory
- 11. Using the Graph Analysis Tools to Graph Data
- 12. Graph Analysis Tool Graph Screen Operations
- 13. Calling E-CON4 Functions from an eActivity
5-33
u To generate a table using a list
1. While the table relation list is on the screen, display the Setup screen.
2. Highlight “Variable” and then press 2(LIST) to display the pop-up window.
3. Select the list whose values you want to assign for the
x -variable.
• To select List 6, for example, press gw. This causes the setting of the Variable
item of the Setup screen to change to List 6.
4. After specifying the list you want to use, press J to return to the previous screen.
u To change the number table character color from the table relation list
screen
The procedure for changing the number table character color from the table relation list screen
is identical to the procedure for changing the graph line color from the graph relation list
screen.
For details, see “To change graph properties from the graph relation list screen” (page 5-15).
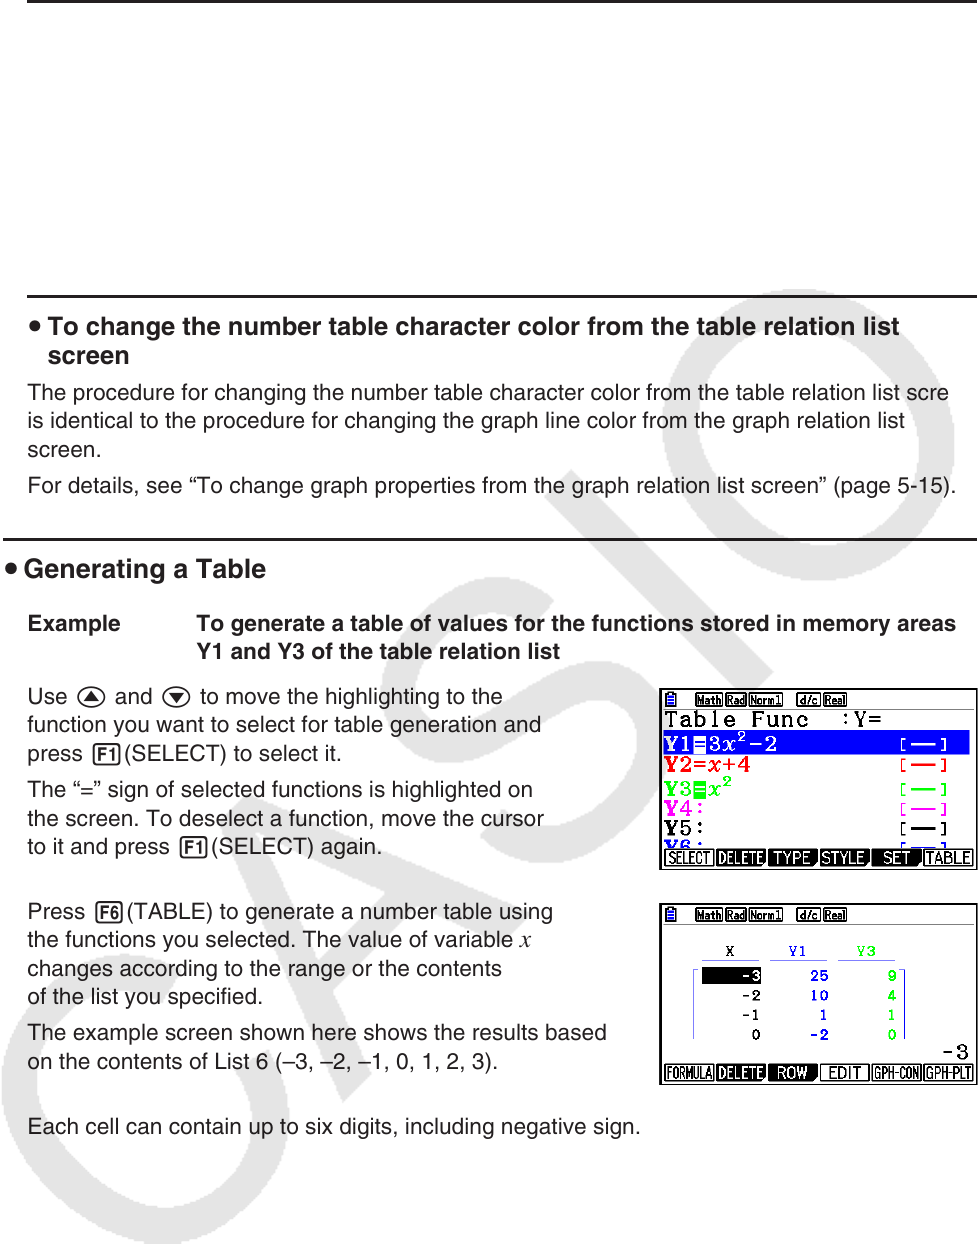
u Generating a Table
Example To generate a table of values for the functions stored in memory areas
Y1 and Y3 of the table relation list
Use f and c to move the highlighting to the
function you want to select for table generation and
press 1(SELECT) to select it.
The “=” sign of selected functions is highlighted on
the screen. To deselect a function, move the cursor
to it and press 1(SELECT) again.
Press 6(TABLE) to generate a number table using
the functions you selected. The value of variable
x
changes according to the range or the contents
of the list you specified.
The example screen shown here shows the results based
on the contents of List 6 (–3, –2, –1, 0, 1, 2, 3).
Each cell can contain up to six digits, including negative sign.