
User Manual

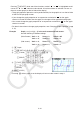
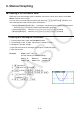
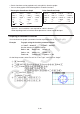
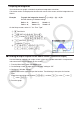
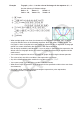
Table Of Contents
- Contents
- Getting Acquainted — Read This First!
- Chapter 1 Basic Operation
- Chapter 2 Manual Calculations
- 1. Basic Calculations
- 2. Special Functions
- 3. Specifying the Angle Unit and Display Format
- 4. Function Calculations
- 5. Numerical Calculations
- 6. Complex Number Calculations
- 7. Binary, Octal, Decimal, and Hexadecimal Calculations with Integers
- 8. Matrix Calculations
- 9. Vector Calculations
- 10. Metric Conversion Calculations
- Chapter 3 List Function
- Chapter 4 Equation Calculations
- Chapter 5 Graphing
- 1. Sample Graphs
- 2. Controlling What Appears on a Graph Screen
- 3. Drawing a Graph
- 4. Saving and Recalling Graph Screen Contents
- 5. Drawing Two Graphs on the Same Screen
- 6. Manual Graphing
- 7. Using Tables
- 8. Modifying a Graph
- 9. Dynamic Graphing
- 10. Graphing a Recursion Formula
- 11. Graphing a Conic Section
- 12. Drawing Dots, Lines, and Text on the Graph Screen (Sketch)
- 13. Function Analysis
- Chapter 6 Statistical Graphs and Calculations
- 1. Before Performing Statistical Calculations
- 2. Calculating and Graphing Single-Variable Statistical Data
- 3. Calculating and Graphing Paired-Variable Statistical Data (Curve Fitting)
- 4. Performing Statistical Calculations
- 5. Tests
- 6. Confidence Interval
- 7. Distribution
- 8. Input and Output Terms of Tests, Confidence Interval, and Distribution
- 9. Statistic Formula
- Chapter 7 Financial Calculation
- Chapter 8 Programming
- Chapter 9 Spreadsheet
- Chapter 10 eActivity
- Chapter 11 Memory Manager
- Chapter 12 System Manager
- Chapter 13 Data Communication
- Chapter 14 Geometry
- Chapter 15 Picture Plot
- Chapter 16 3D Graph Function
- Appendix
- Examination Mode
- E-CON4 Application (English)
- 1. E-CON4 Mode Overview
- 2. Sampling Screen
- 3. Auto Sensor Detection (CLAB Only)
- 4. Selecting a Sensor
- 5. Configuring the Sampling Setup
- 6. Performing Auto Sensor Calibration and Zero Adjustment
- 7. Using a Custom Probe
- 8. Using Setup Memory
- 9. Starting a Sampling Operation
- 10. Using Sample Data Memory
- 11. Using the Graph Analysis Tools to Graph Data
- 12. Graph Analysis Tool Graph Screen Operations
- 13. Calling E-CON4 Functions from an eActivity
5-23
5. Drawing Two Graphs on the Same Screen
k Copying the Graph to the Sub-screen
Dual Graph lets you split the screen into two parts. Then you can graph two different functions
in each for comparison, or draw a normal size graph on one side and its enlarged version on
the other side. This makes Dual Graph a powerful graph analysis tool.
With Dual Graph, the left side of the screen is called the “main screen”, while the right side is
called the “sub-screen”.
u Main Screen
The graph in the main screen is actually drawn from a function.
u Sub-screen
The graph on the sub-screen is produced by copying or zooming the main screen graph.
You can even make different V-Window settings for the sub-screen and main screen.
u To copy the graph to the sub-screen
1. From the Main Menu, enter the Graph mode.
2. On the Setup screen, select “G + G” for “Dual Screen”.
3. Configure V-Window settings for the main screen.
Press 6(RIGHT) to display the sub-graph settings screen. Pressing 6(LEFT) returns to
the main screen setting screen.
4. Store the function, and draw the graph in the main screen.
5. Perform the Dual Graph operation you want.
K1(COPY) ... Duplicates the main screen graph in the sub-screen
K2(SWAP) ... Swaps the main screen contents and sub-screen contents
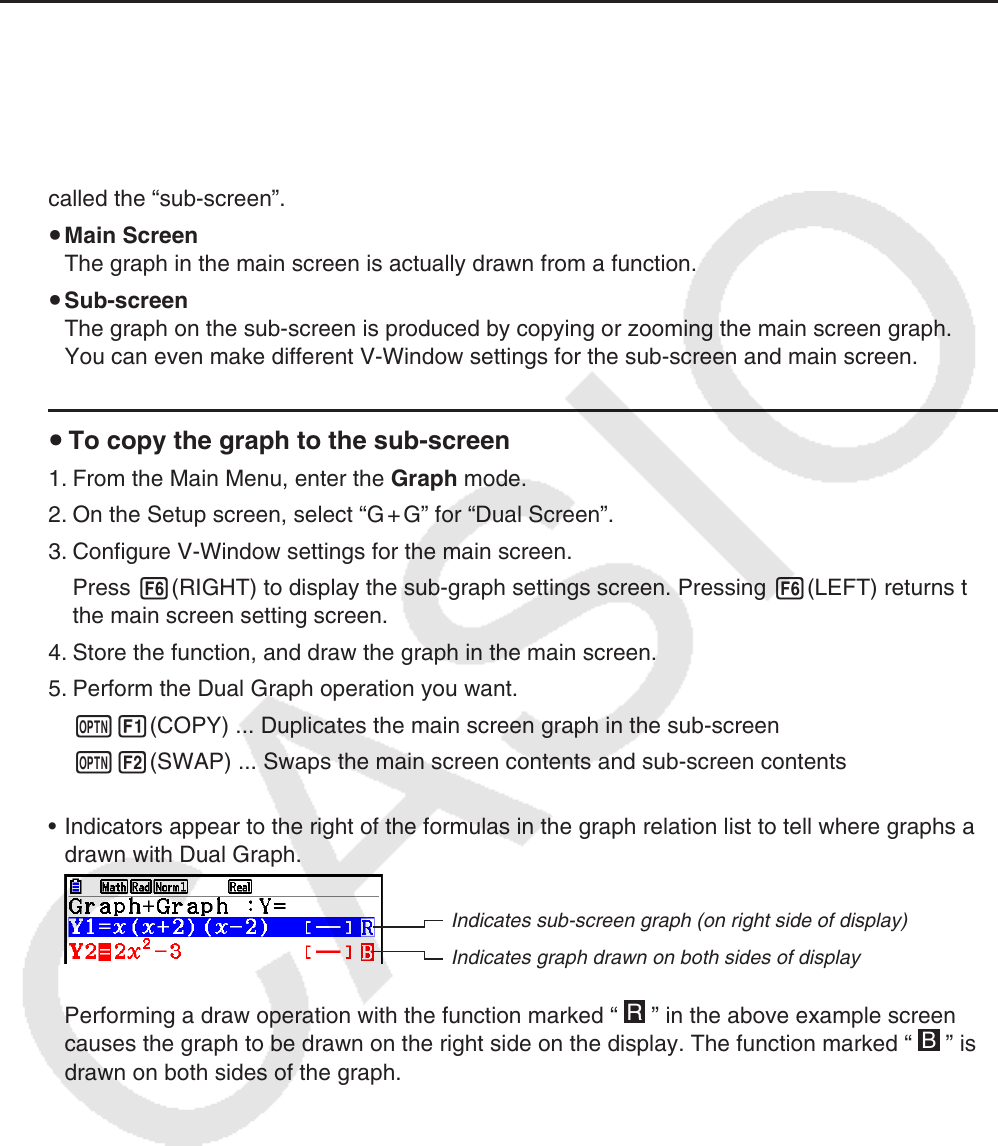
• Indicators appear to the right of the formulas in the graph relation list to tell where graphs are
drawn with Dual Graph.
Indicates sub-screen graph (on right side of display)
Indicates graph drawn on both sides of display
Performing a draw operation with the function marked “
R
” in the above example screen
causes the graph to be drawn on the right side on the display. The function marked “
B
” is
drawn on both sides of the graph.