
User Manual
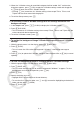
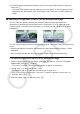
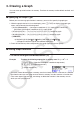
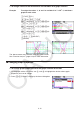


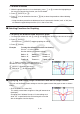
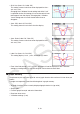
Table Of Contents
- Contents
- Getting Acquainted — Read This First!
- Chapter 1 Basic Operation
- Chapter 2 Manual Calculations
- 1. Basic Calculations
- 2. Special Functions
- 3. Specifying the Angle Unit and Display Format
- 4. Function Calculations
- 5. Numerical Calculations
- 6. Complex Number Calculations
- 7. Binary, Octal, Decimal, and Hexadecimal Calculations with Integers
- 8. Matrix Calculations
- 9. Vector Calculations
- 10. Metric Conversion Calculations
- Chapter 3 List Function
- Chapter 4 Equation Calculations
- Chapter 5 Graphing
- 1. Sample Graphs
- 2. Controlling What Appears on a Graph Screen
- 3. Drawing a Graph
- 4. Saving and Recalling Graph Screen Contents
- 5. Drawing Two Graphs on the Same Screen
- 6. Manual Graphing
- 7. Using Tables
- 8. Modifying a Graph
- 9. Dynamic Graphing
- 10. Graphing a Recursion Formula
- 11. Graphing a Conic Section
- 12. Drawing Dots, Lines, and Text on the Graph Screen (Sketch)
- 13. Function Analysis
- Chapter 6 Statistical Graphs and Calculations
- 1. Before Performing Statistical Calculations
- 2. Calculating and Graphing Single-Variable Statistical Data
- 3. Calculating and Graphing Paired-Variable Statistical Data (Curve Fitting)
- 4. Performing Statistical Calculations
- 5. Tests
- 6. Confidence Interval
- 7. Distribution
- 8. Input and Output Terms of Tests, Confidence Interval, and Distribution
- 9. Statistic Formula
- Chapter 7 Financial Calculation
- Chapter 8 Programming
- Chapter 9 Spreadsheet
- Chapter 10 eActivity
- Chapter 11 Memory Manager
- Chapter 12 System Manager
- Chapter 13 Data Communication
- Chapter 14 Geometry
- Chapter 15 Picture Plot
- Chapter 16 3D Graph Function
- Appendix
- Examination Mode
- E-CON4 Application (English)
- 1. E-CON4 Mode Overview
- 2. Sampling Screen
- 3. Auto Sensor Detection (CLAB Only)
- 4. Selecting a Sensor
- 5. Configuring the Sampling Setup
- 6. Performing Auto Sensor Calibration and Zero Adjustment
- 7. Using a Custom Probe
- 8. Using Setup Memory
- 9. Starting a Sampling Operation
- 10. Using Sample Data Memory
- 11. Using the Graph Analysis Tools to Graph Data
- 12. Graph Analysis Tool Graph Screen Operations
- 13. Calling E-CON4 Functions from an eActivity
5-19
• Grid: Line (Axes: On, Label: Off)
This setting causes scale lines to be displayed for the
x-
axis and y-axis.
Changing the V-Window Xscale setting to 0 while “Line”
is specified for the Grid setting will cause the vertical lines
to disappear from the display. Changing the V-Window
Yscale setting to 0 will cause the horizontal lines to
disappear.
• Axes: Off (Label: Off, Grid: Off)
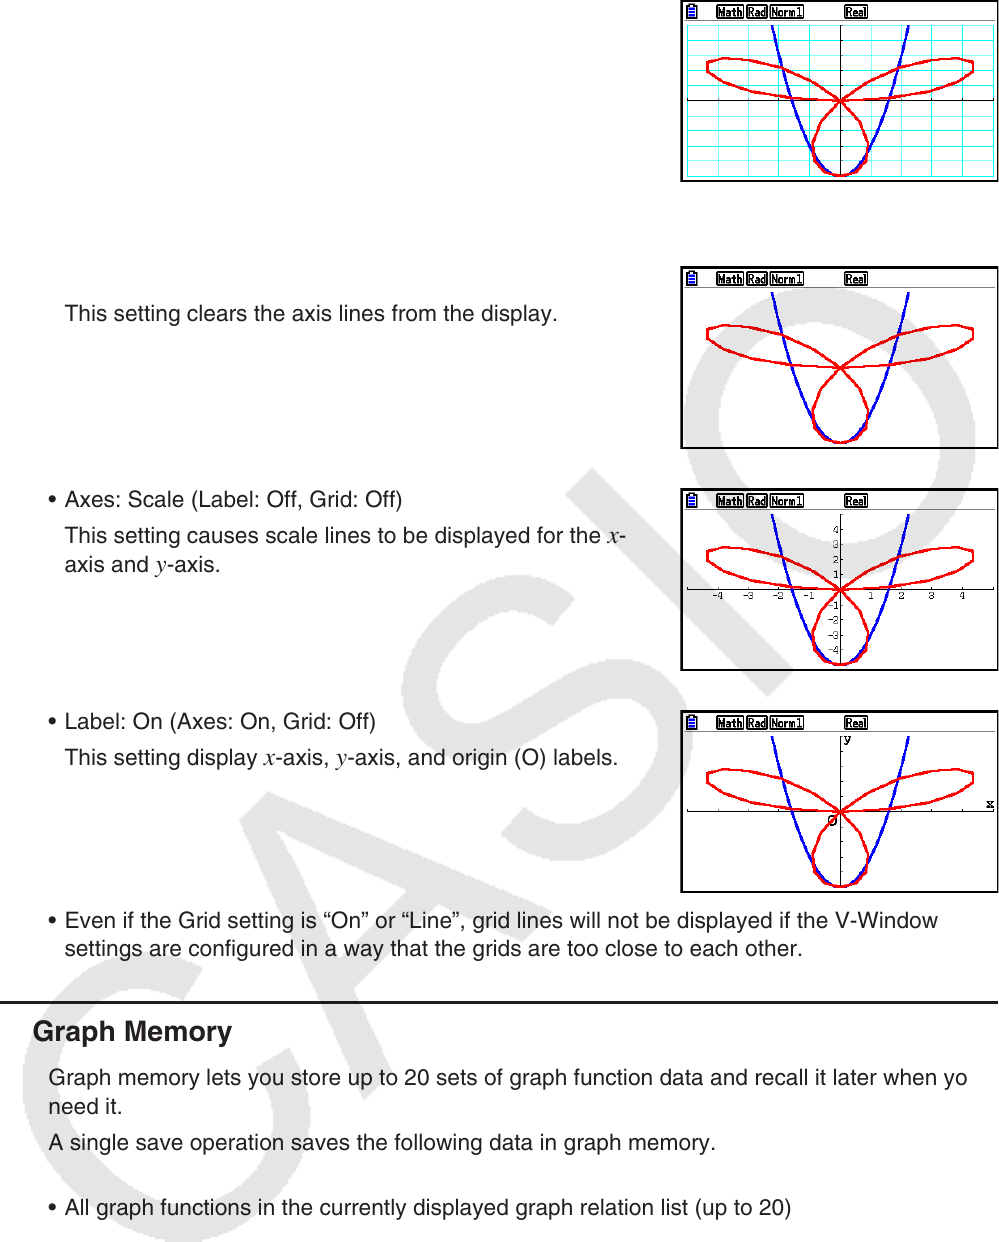
This setting clears the axis lines from the display.
• Axes: Scale (Label: Off, Grid: Off)
This setting causes scale lines to be displayed for the
x-
axis and
y-axis.
• Label: On (Axes: On, Grid: Off)
This setting display
x-axis, y-axis, and origin (O) labels.
• Even if the Grid setting is “On” or “Line”, grid lines will not be displayed if the V-Window
settings are configured in a way that the grids are too close to each other.
k Graph Memory
Graph memory lets you store up to 20 sets of graph function data and recall it later when you
need it.
A single save operation saves the following data in graph memory.
• All graph functions in the currently displayed graph relation list (up to 20)
• Graph types
• Function graph line style and color information
• Draw/non-draw status
• V-Window settings (1 set)