
User Manual
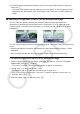
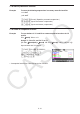
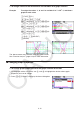


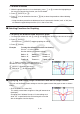
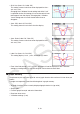
Table Of Contents
- Contents
- Getting Acquainted — Read This First!
- Chapter 1 Basic Operation
- Chapter 2 Manual Calculations
- 1. Basic Calculations
- 2. Special Functions
- 3. Specifying the Angle Unit and Display Format
- 4. Function Calculations
- 5. Numerical Calculations
- 6. Complex Number Calculations
- 7. Binary, Octal, Decimal, and Hexadecimal Calculations with Integers
- 8. Matrix Calculations
- 9. Vector Calculations
- 10. Metric Conversion Calculations
- Chapter 3 List Function
- Chapter 4 Equation Calculations
- Chapter 5 Graphing
- 1. Sample Graphs
- 2. Controlling What Appears on a Graph Screen
- 3. Drawing a Graph
- 4. Saving and Recalling Graph Screen Contents
- 5. Drawing Two Graphs on the Same Screen
- 6. Manual Graphing
- 7. Using Tables
- 8. Modifying a Graph
- 9. Dynamic Graphing
- 10. Graphing a Recursion Formula
- 11. Graphing a Conic Section
- 12. Drawing Dots, Lines, and Text on the Graph Screen (Sketch)
- 13. Function Analysis
- Chapter 6 Statistical Graphs and Calculations
- 1. Before Performing Statistical Calculations
- 2. Calculating and Graphing Single-Variable Statistical Data
- 3. Calculating and Graphing Paired-Variable Statistical Data (Curve Fitting)
- 4. Performing Statistical Calculations
- 5. Tests
- 6. Confidence Interval
- 7. Distribution
- 8. Input and Output Terms of Tests, Confidence Interval, and Distribution
- 9. Statistic Formula
- Chapter 7 Financial Calculation
- Chapter 8 Programming
- Chapter 9 Spreadsheet
- Chapter 10 eActivity
- Chapter 11 Memory Manager
- Chapter 12 System Manager
- Chapter 13 Data Communication
- Chapter 14 Geometry
- Chapter 15 Picture Plot
- Chapter 16 3D Graph Function
- Appendix
- Examination Mode
- E-CON4 Application (English)
- 1. E-CON4 Mode Overview
- 2. Sampling Screen
- 3. Auto Sensor Detection (CLAB Only)
- 4. Selecting a Sensor
- 5. Configuring the Sampling Setup
- 6. Performing Auto Sensor Calibration and Zero Adjustment
- 7. Using a Custom Probe
- 8. Using Setup Memory
- 9. Starting a Sampling Operation
- 10. Using Sample Data Memory
- 11. Using the Graph Analysis Tools to Graph Data
- 12. Graph Analysis Tool Graph Screen Operations
- 13. Calling E-CON4 Functions from an eActivity
5-11
5. When the “V-Window values for specified background will be loaded. OK?” confirmation
dialog box appears, press 1(Yes) to apply the V-Window settings saved with the g3p file
or 6(No) to retain the current V-Window settings.
• Pressing 1(Yes) overwrites all V-Window setting values except T
min, Tmax, and
Tptch with the values stored with the g3p file.
6. To exit the Setup screen, press J.
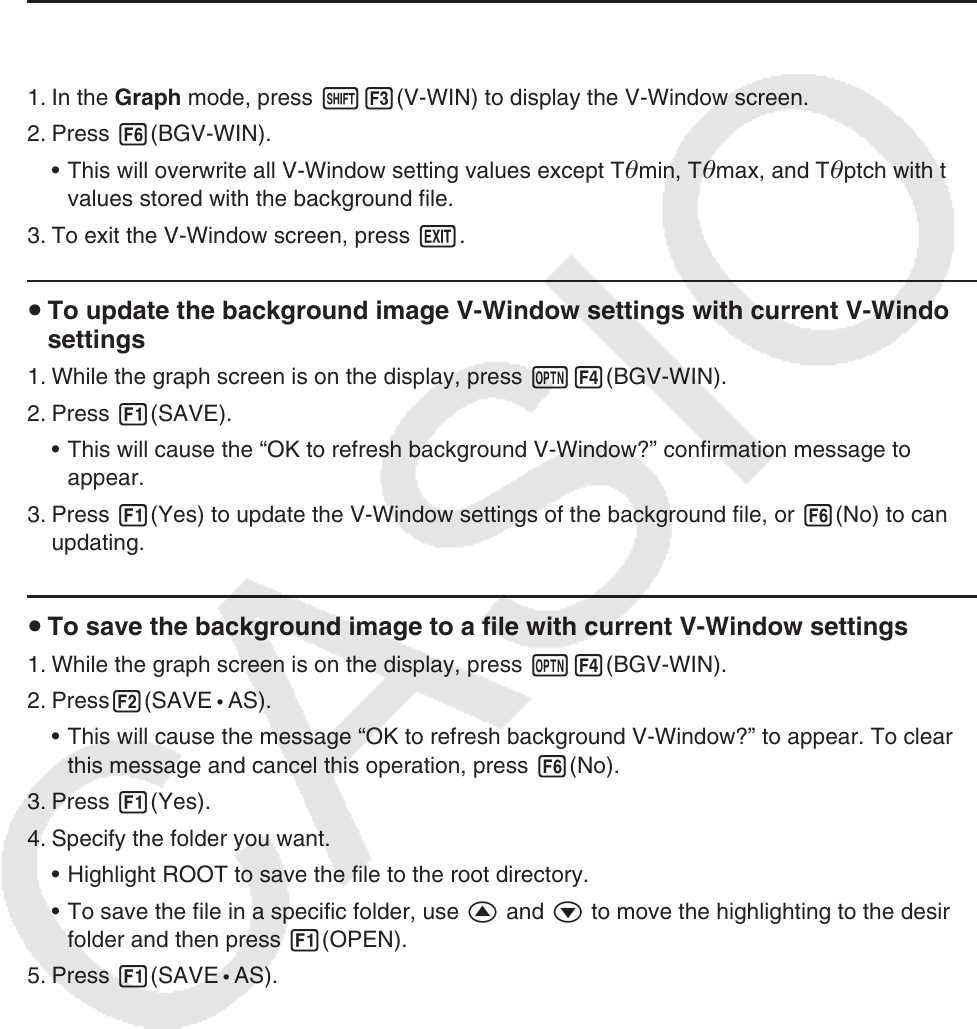
u To overwrite current V-Window settings with the settings saved with the
background image
1. In the Graph mode, press !3(V-WIN) to display the V-Window screen.
2. Press 6(BGV-WIN).
• This will overwrite all V-Window setting values except T
min, Tmax, and Tptch with the
values stored with the background file.
3. To exit the V-Window screen, press J.
u To update the background image V-Window settings with current V-Window
settings
1. While the graph screen is on the display, press K4(BGV-WIN).
2. Press 1(SAVE).
• This will cause the “OK to refresh background V-Window?” confirmation message to
appear.
3. Press 1(Yes) to update the V-Window settings of the background file, or 6(No) to cancel
updating.
u To save the background image to a file with current V-Window settings
1. While the graph screen is on the display, press K4(BGV-WIN).
2. Press2(SAVE
• AS).
• This will cause the message “OK to refresh background V-Window?” to appear. To clear
this message and cancel this operation, press 6(No).
3. Press 1(Yes).
4. Specify the folder you want.
• Highlight ROOT to save the file to the root directory.
• To save the file in a specific folder, use f and c to move the highlighting to the desired
folder and then press 1(OPEN).
5. Press 1(SAVE
• AS).