
User Manual
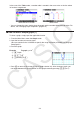
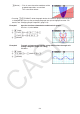
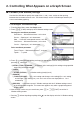
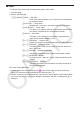
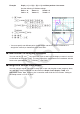
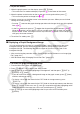
Table Of Contents
- Contents
- Getting Acquainted — Read This First!
- Chapter 1 Basic Operation
- Chapter 2 Manual Calculations
- 1. Basic Calculations
- 2. Special Functions
- 3. Specifying the Angle Unit and Display Format
- 4. Function Calculations
- 5. Numerical Calculations
- 6. Complex Number Calculations
- 7. Binary, Octal, Decimal, and Hexadecimal Calculations with Integers
- 8. Matrix Calculations
- 9. Vector Calculations
- 10. Metric Conversion Calculations
- Chapter 3 List Function
- Chapter 4 Equation Calculations
- Chapter 5 Graphing
- 1. Sample Graphs
- 2. Controlling What Appears on a Graph Screen
- 3. Drawing a Graph
- 4. Saving and Recalling Graph Screen Contents
- 5. Drawing Two Graphs on the Same Screen
- 6. Manual Graphing
- 7. Using Tables
- 8. Modifying a Graph
- 9. Dynamic Graphing
- 10. Graphing a Recursion Formula
- 11. Graphing a Conic Section
- 12. Drawing Dots, Lines, and Text on the Graph Screen (Sketch)
- 13. Function Analysis
- Chapter 6 Statistical Graphs and Calculations
- 1. Before Performing Statistical Calculations
- 2. Calculating and Graphing Single-Variable Statistical Data
- 3. Calculating and Graphing Paired-Variable Statistical Data (Curve Fitting)
- 4. Performing Statistical Calculations
- 5. Tests
- 6. Confidence Interval
- 7. Distribution
- 8. Input and Output Terms of Tests, Confidence Interval, and Distribution
- 9. Statistic Formula
- Chapter 7 Financial Calculation
- Chapter 8 Programming
- Chapter 9 Spreadsheet
- Chapter 10 eActivity
- Chapter 11 Memory Manager
- Chapter 12 System Manager
- Chapter 13 Data Communication
- Chapter 14 Geometry
- Chapter 15 Picture Plot
- Chapter 16 3D Graph Function
- Appendix
- Examination Mode
- E-CON4 Application (English)
- 1. E-CON4 Mode Overview
- 2. Sampling Screen
- 3. Auto Sensor Detection (CLAB Only)
- 4. Selecting a Sensor
- 5. Configuring the Sampling Setup
- 6. Performing Auto Sensor Calibration and Zero Adjustment
- 7. Using a Custom Probe
- 8. Using Setup Memory
- 9. Starting a Sampling Operation
- 10. Using Sample Data Memory
- 11. Using the Graph Analysis Tools to Graph Data
- 12. Graph Analysis Tool Graph Screen Operations
- 13. Calling E-CON4 Functions from an eActivity
5-6
u V-Window Setting Precautions
• Inputting zero for T
θ
ptch causes an error.
• Any illegal input (out of range value, negative sign without a value, etc.) causes an error.
• When T
θ
max is less than T
θ
min, T
θ
ptch becomes negative.
• You can input expressions (such as 2 π ) as V-Window parameters.
• When the V-Window setting produces an axis that does not fit on the display, the scale of
the axis is indicated on the edge of the display closest to the origin.
• Changing the V-Window settings clears the graph currently on the display and replaces it
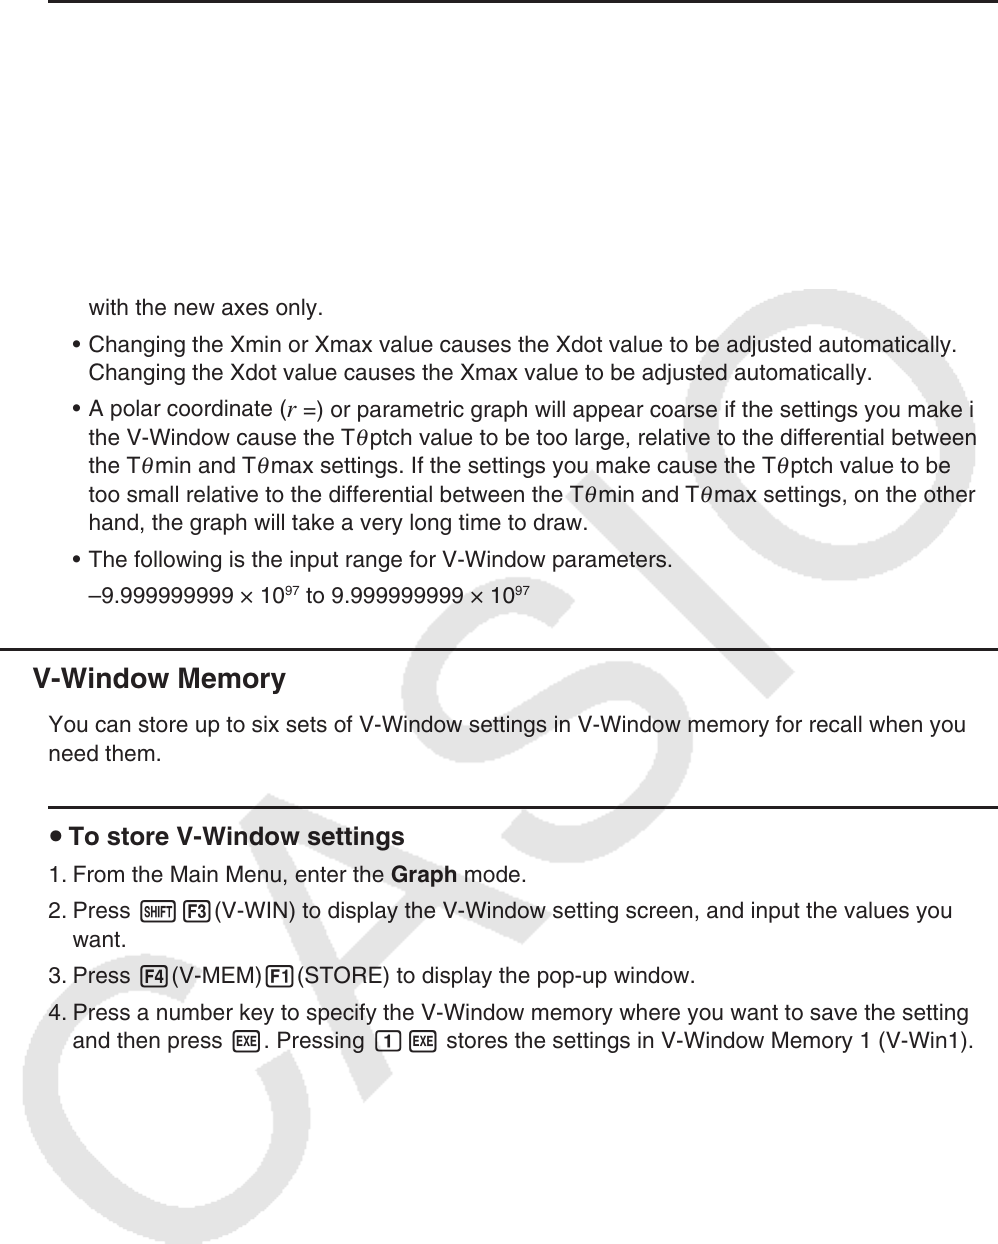
with the new axes only.
• Changing the Xmin or Xmax value causes the Xdot value to be adjusted automatically.
Changing the Xdot value causes the Xmax value to be adjusted automatically.
• A polar coordinate (
r =) or parametric graph will appear coarse if the settings you make in
the V-Window cause the T
θ
ptch value to be too large, relative to the differential between
the T
θ
min and T
θ
max settings. If the settings you make cause the T
θ
ptch value to be
too small relative to the differential between the T
θ
min and T
θ
max settings, on the other
hand, the graph will take a very long time to draw.
• The following is the input range for V-Window parameters.
–9.999999999
× 10
97
to 9.999999999 × 10
97
k V-Window Memory
You can store up to six sets of V-Window settings in V-Window memory for recall when you
need them.
u To store V-Window settings
1. From the Main Menu, enter the Graph mode.
2. Press !3(V-WIN) to display the V-Window setting screen, and input the values you
want.
3. Press 4(V-MEM)1(STORE) to display the pop-up window.
4. Press a number key to specify the V-Window memory where you want to save the settings,
and then press w. Pressing bw stores the settings in V-Window Memory 1 (V-Win1).