
User Manual
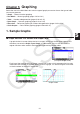
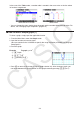
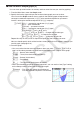
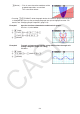
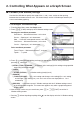
Table Of Contents
- Contents
- Getting Acquainted — Read This First!
- Chapter 1 Basic Operation
- Chapter 2 Manual Calculations
- 1. Basic Calculations
- 2. Special Functions
- 3. Specifying the Angle Unit and Display Format
- 4. Function Calculations
- 5. Numerical Calculations
- 6. Complex Number Calculations
- 7. Binary, Octal, Decimal, and Hexadecimal Calculations with Integers
- 8. Matrix Calculations
- 9. Vector Calculations
- 10. Metric Conversion Calculations
- Chapter 3 List Function
- Chapter 4 Equation Calculations
- Chapter 5 Graphing
- 1. Sample Graphs
- 2. Controlling What Appears on a Graph Screen
- 3. Drawing a Graph
- 4. Saving and Recalling Graph Screen Contents
- 5. Drawing Two Graphs on the Same Screen
- 6. Manual Graphing
- 7. Using Tables
- 8. Modifying a Graph
- 9. Dynamic Graphing
- 10. Graphing a Recursion Formula
- 11. Graphing a Conic Section
- 12. Drawing Dots, Lines, and Text on the Graph Screen (Sketch)
- 13. Function Analysis
- Chapter 6 Statistical Graphs and Calculations
- 1. Before Performing Statistical Calculations
- 2. Calculating and Graphing Single-Variable Statistical Data
- 3. Calculating and Graphing Paired-Variable Statistical Data (Curve Fitting)
- 4. Performing Statistical Calculations
- 5. Tests
- 6. Confidence Interval
- 7. Distribution
- 8. Input and Output Terms of Tests, Confidence Interval, and Distribution
- 9. Statistic Formula
- Chapter 7 Financial Calculation
- Chapter 8 Programming
- Chapter 9 Spreadsheet
- Chapter 10 eActivity
- Chapter 11 Memory Manager
- Chapter 12 System Manager
- Chapter 13 Data Communication
- Chapter 14 Geometry
- Chapter 15 Picture Plot
- Chapter 16 3D Graph Function
- Appendix
- Examination Mode
- E-CON4 Application (English)
- 1. E-CON4 Mode Overview
- 2. Sampling Screen
- 3. Auto Sensor Detection (CLAB Only)
- 4. Selecting a Sensor
- 5. Configuring the Sampling Setup
- 6. Performing Auto Sensor Calibration and Zero Adjustment
- 7. Using a Custom Probe
- 8. Using Setup Memory
- 9. Starting a Sampling Operation
- 10. Using Sample Data Memory
- 11. Using the Graph Analysis Tools to Graph Data
- 12. Graph Analysis Tool Graph Screen Operations
- 13. Calling E-CON4 Functions from an eActivity
5-5
2. Controlling What Appears on a Graph Screen
k V-Window (View Window) Settings
Use the View Window to specify the range of the x - and y -axes, and to set the spacing
between the increments on each axis. You should always set the V-Window parameters you
want to use before graphing.
u To configure V-Window settings
1. From the Main Menu, enter the Graph mode.
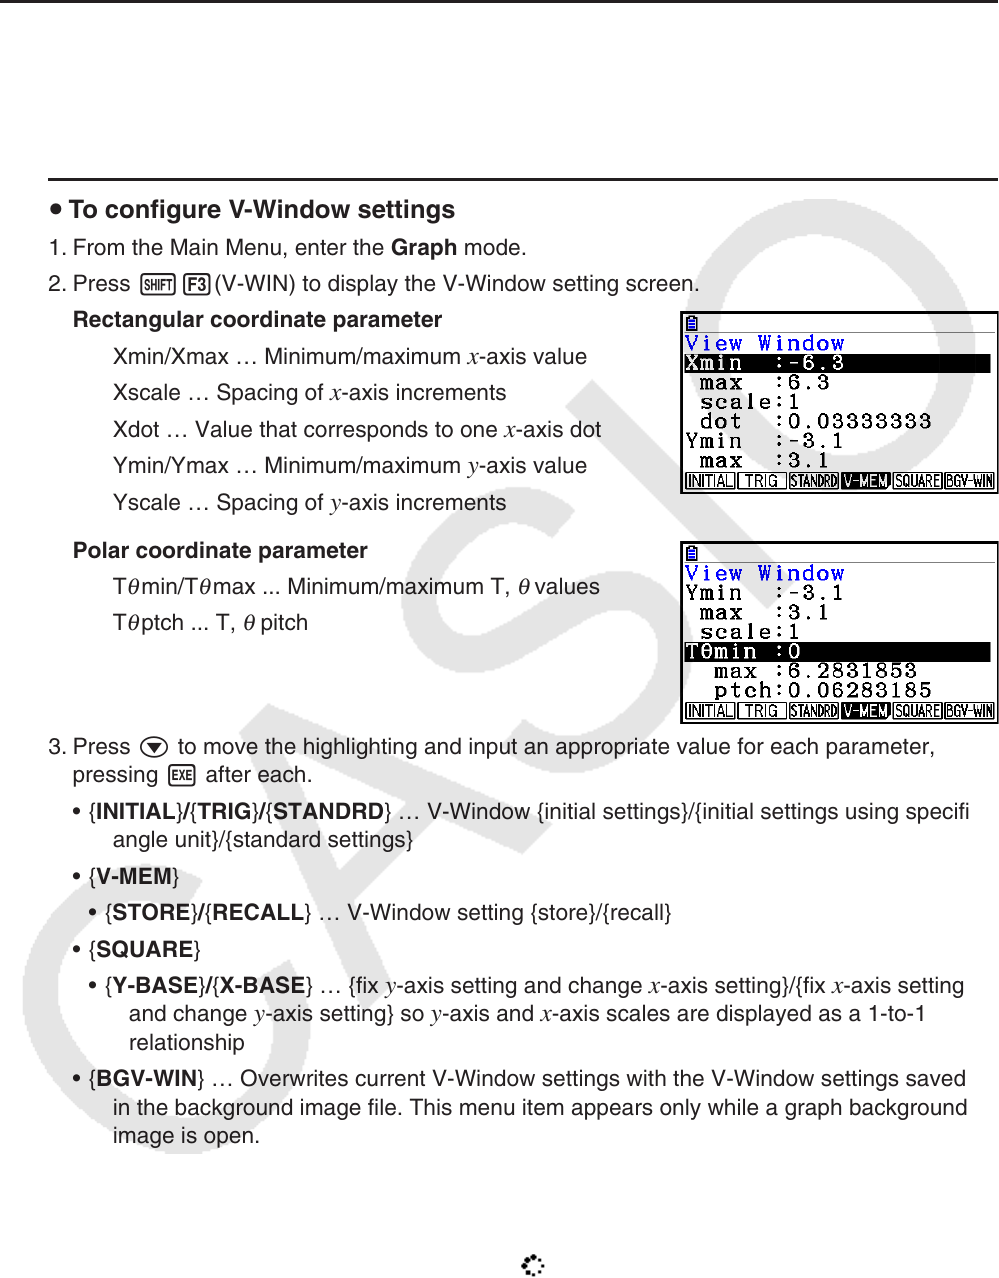
2. Press !3(V-WIN) to display the V-Window setting screen.
Rectangular coordinate parameter
Xmin/Xmax … Minimum/maximum
x-axis value
Xscale … Spacing of
x-axis increments
Xdot … Value that corresponds to one
x-axis dot
Ymin/Ymax … Minimum/maximum
y-axis value
Yscale … Spacing of
y-axis increments
Polar coordinate parameter
T
θ
min/T
θ
max ... Minimum/maximum T,
θ
values
T
θ
ptch ... T,
θ
pitch
3. Press c to move the highlighting and input an appropriate value for each parameter,
pressing w after each.
• {INITIAL}/{TRIG}/{STANDRD} … V-Window {initial settings}/{initial settings using specified
angle unit}/{standard settings}
• {V-MEM}
• {STORE}/{RECALL} … V-Window setting {store}/{recall}
• {SQUARE}
• {Y-BASE}/{X-BASE} … {fix
y-axis setting and change x-axis setting}/{fix x-axis setting
and change y-axis setting} so y-axis and x-axis scales are displayed as a 1-to-1
relationship
• {BGV-WIN} … Overwrites current V-Window settings with the V-Window settings saved
in the background image file. This menu item appears only while a graph background
image is open.
4. After settings are the way you want them, press J or !J(QUIT) to exit the V-
Window setting screen.
• Pressing w without inputting anything while
is on the display exits the V-Window setting
screen.