
User Manual
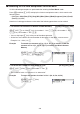
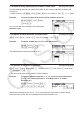
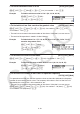

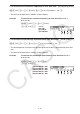
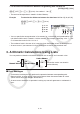
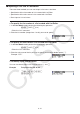
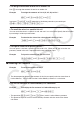
Table Of Contents
- Contents
- Getting Acquainted — Read This First!
- Chapter 1 Basic Operation
- Chapter 2 Manual Calculations
- 1. Basic Calculations
- 2. Special Functions
- 3. Specifying the Angle Unit and Display Format
- 4. Function Calculations
- 5. Numerical Calculations
- 6. Complex Number Calculations
- 7. Binary, Octal, Decimal, and Hexadecimal Calculations with Integers
- 8. Matrix Calculations
- 9. Vector Calculations
- 10. Metric Conversion Calculations
- Chapter 3 List Function
- Chapter 4 Equation Calculations
- Chapter 5 Graphing
- 1. Sample Graphs
- 2. Controlling What Appears on a Graph Screen
- 3. Drawing a Graph
- 4. Saving and Recalling Graph Screen Contents
- 5. Drawing Two Graphs on the Same Screen
- 6. Manual Graphing
- 7. Using Tables
- 8. Modifying a Graph
- 9. Dynamic Graphing
- 10. Graphing a Recursion Formula
- 11. Graphing a Conic Section
- 12. Drawing Dots, Lines, and Text on the Graph Screen (Sketch)
- 13. Function Analysis
- Chapter 6 Statistical Graphs and Calculations
- 1. Before Performing Statistical Calculations
- 2. Calculating and Graphing Single-Variable Statistical Data
- 3. Calculating and Graphing Paired-Variable Statistical Data (Curve Fitting)
- 4. Performing Statistical Calculations
- 5. Tests
- 6. Confidence Interval
- 7. Distribution
- 8. Input and Output Terms of Tests, Confidence Interval, and Distribution
- 9. Statistic Formula
- Chapter 7 Financial Calculation
- Chapter 8 Programming
- Chapter 9 Spreadsheet
- Chapter 10 eActivity
- Chapter 11 Memory Manager
- Chapter 12 System Manager
- Chapter 13 Data Communication
- Chapter 14 Geometry
- Chapter 15 Picture Plot
- Chapter 16 3D Graph Function
- Appendix
- Examination Mode
- E-CON4 Application (English)
- 1. E-CON4 Mode Overview
- 2. Sampling Screen
- 3. Auto Sensor Detection (CLAB Only)
- 4. Selecting a Sensor
- 5. Configuring the Sampling Setup
- 6. Performing Auto Sensor Calibration and Zero Adjustment
- 7. Using a Custom Probe
- 8. Using Setup Memory
- 9. Starting a Sampling Operation
- 10. Using Sample Data Memory
- 11. Using the Graph Analysis Tools to Graph Data
- 12. Graph Analysis Tool Graph Screen Operations
- 13. Calling E-CON4 Functions from an eActivity
3-11
Example To calculate the median of values in List 1 (36, 16, 58, 46, 56), whose
frequency is indicated by List 2 (75, 89, 98, 72, 67)
AK1(LIST) 6( g) 4(Med)
6( g) 6( g) 1(List) b,
1(List) c)w
u To combine lists [OPTN] - [LIST] - [Augment]
• You can combine two different lists into a single list. The result of a list combination operation
is stored in ListAns memory.
K1(LIST) 6( g) 5(Augment) 6( g) 6( g) 1(List) <list number 1 - 26> ,1(List)
<list number 1 - 26> )w
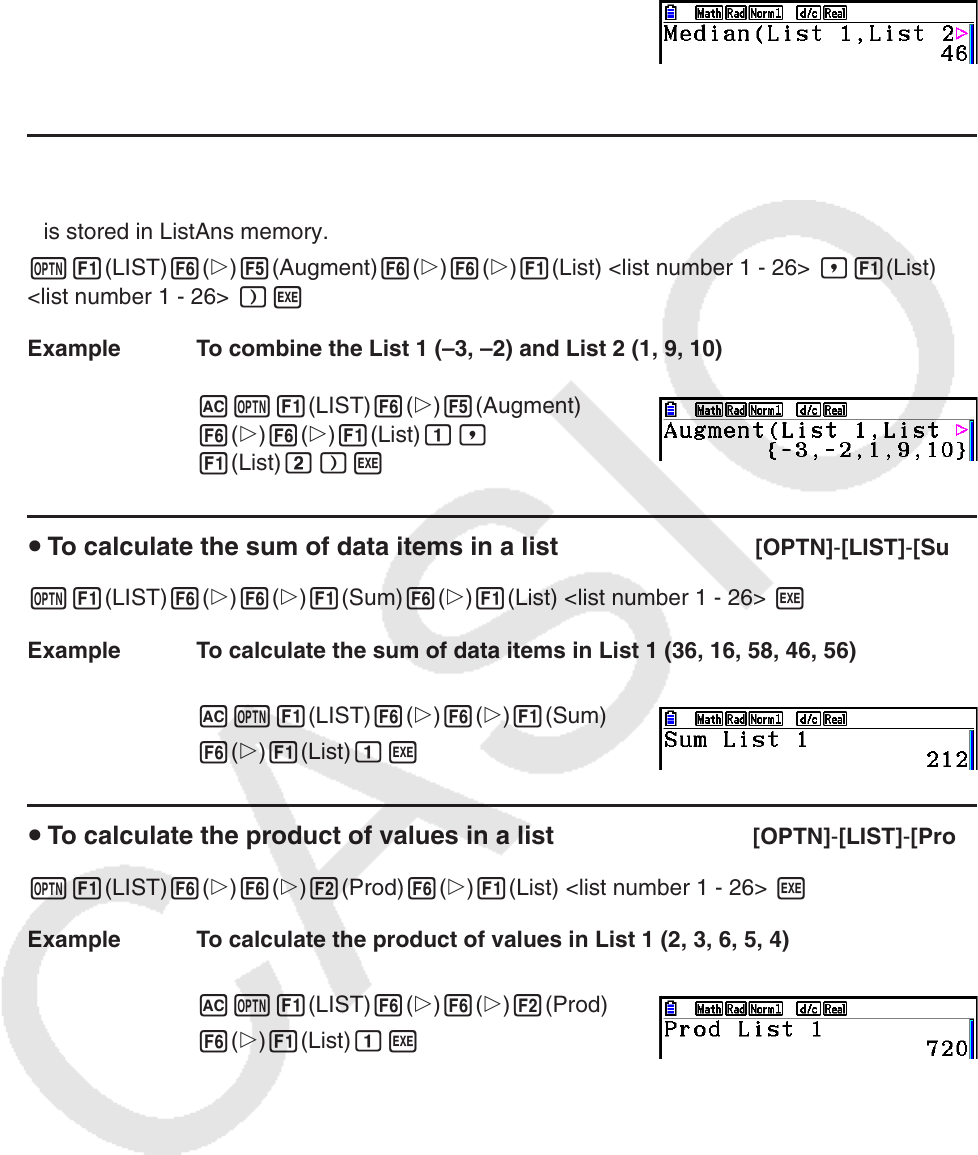
Example To combine the List 1 (–3, –2) and List 2 (1, 9, 10)
AK1(LIST) 6( g) 5(Augment)
6( g) 6( g) 1(List) b,
1(List) c)w
u To calculate the sum of data items in a list [OPTN] - [LIST] - [Sum]
K1(LIST) 6( g) 6( g) 1(Sum) 6( g) 1(List) <list number 1 - 26> w
Example To calculate the sum of data items in List 1 (36, 16, 58, 46, 56)
AK1(LIST) 6( g) 6( g) 1(Sum)
6( g) 1(List) bw
u To calculate the product of values in a list [OPTN] - [LIST] - [Prod]
K1(LIST) 6( g) 6( g) 2(Prod) 6( g) 1(List) <list number 1 - 26> w
Example To calculate the product of values in List 1 (2, 3, 6, 5, 4)
AK1(LIST) 6( g) 6( g) 2(Prod)
6( g) 1(List) bw