
User Manual
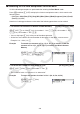
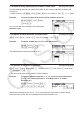
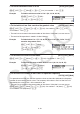

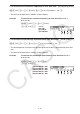
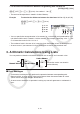
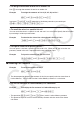
Table Of Contents
- Contents
- Getting Acquainted — Read This First!
- Chapter 1 Basic Operation
- Chapter 2 Manual Calculations
- 1. Basic Calculations
- 2. Special Functions
- 3. Specifying the Angle Unit and Display Format
- 4. Function Calculations
- 5. Numerical Calculations
- 6. Complex Number Calculations
- 7. Binary, Octal, Decimal, and Hexadecimal Calculations with Integers
- 8. Matrix Calculations
- 9. Vector Calculations
- 10. Metric Conversion Calculations
- Chapter 3 List Function
- Chapter 4 Equation Calculations
- Chapter 5 Graphing
- 1. Sample Graphs
- 2. Controlling What Appears on a Graph Screen
- 3. Drawing a Graph
- 4. Saving and Recalling Graph Screen Contents
- 5. Drawing Two Graphs on the Same Screen
- 6. Manual Graphing
- 7. Using Tables
- 8. Modifying a Graph
- 9. Dynamic Graphing
- 10. Graphing a Recursion Formula
- 11. Graphing a Conic Section
- 12. Drawing Dots, Lines, and Text on the Graph Screen (Sketch)
- 13. Function Analysis
- Chapter 6 Statistical Graphs and Calculations
- 1. Before Performing Statistical Calculations
- 2. Calculating and Graphing Single-Variable Statistical Data
- 3. Calculating and Graphing Paired-Variable Statistical Data (Curve Fitting)
- 4. Performing Statistical Calculations
- 5. Tests
- 6. Confidence Interval
- 7. Distribution
- 8. Input and Output Terms of Tests, Confidence Interval, and Distribution
- 9. Statistic Formula
- Chapter 7 Financial Calculation
- Chapter 8 Programming
- Chapter 9 Spreadsheet
- Chapter 10 eActivity
- Chapter 11 Memory Manager
- Chapter 12 System Manager
- Chapter 13 Data Communication
- Chapter 14 Geometry
- Chapter 15 Picture Plot
- Chapter 16 3D Graph Function
- Appendix
- Examination Mode
- E-CON4 Application (English)
- 1. E-CON4 Mode Overview
- 2. Sampling Screen
- 3. Auto Sensor Detection (CLAB Only)
- 4. Selecting a Sensor
- 5. Configuring the Sampling Setup
- 6. Performing Auto Sensor Calibration and Zero Adjustment
- 7. Using a Custom Probe
- 8. Using Setup Memory
- 9. Starting a Sampling Operation
- 10. Using Sample Data Memory
- 11. Using the Graph Analysis Tools to Graph Data
- 12. Graph Analysis Tool Graph Screen Operations
- 13. Calling E-CON4 Functions from an eActivity
3-9
u To create a list by specifying the number of data items [OPTN] - [LIST] - [Dim]
Use the following procedure to specify the number of data in the assignment statement and
create a list.
<number of data
n > aK1(LIST) 3(Dim) 1(List) <list number 1 - 26> w ( n = 1 - 999)
Example To create five data items (each of which contains 0) in List 1
AfaK1(LIST) 3(Dim)
1(List) bw
You can view the newly created list by entering the
Statistics mode.
u To replace all data items with the same value [OPTN] - [LIST] - [Fill(]
K1(LIST) 4(Fill( ) <value> ,1(List) <list number 1 - 26> )w
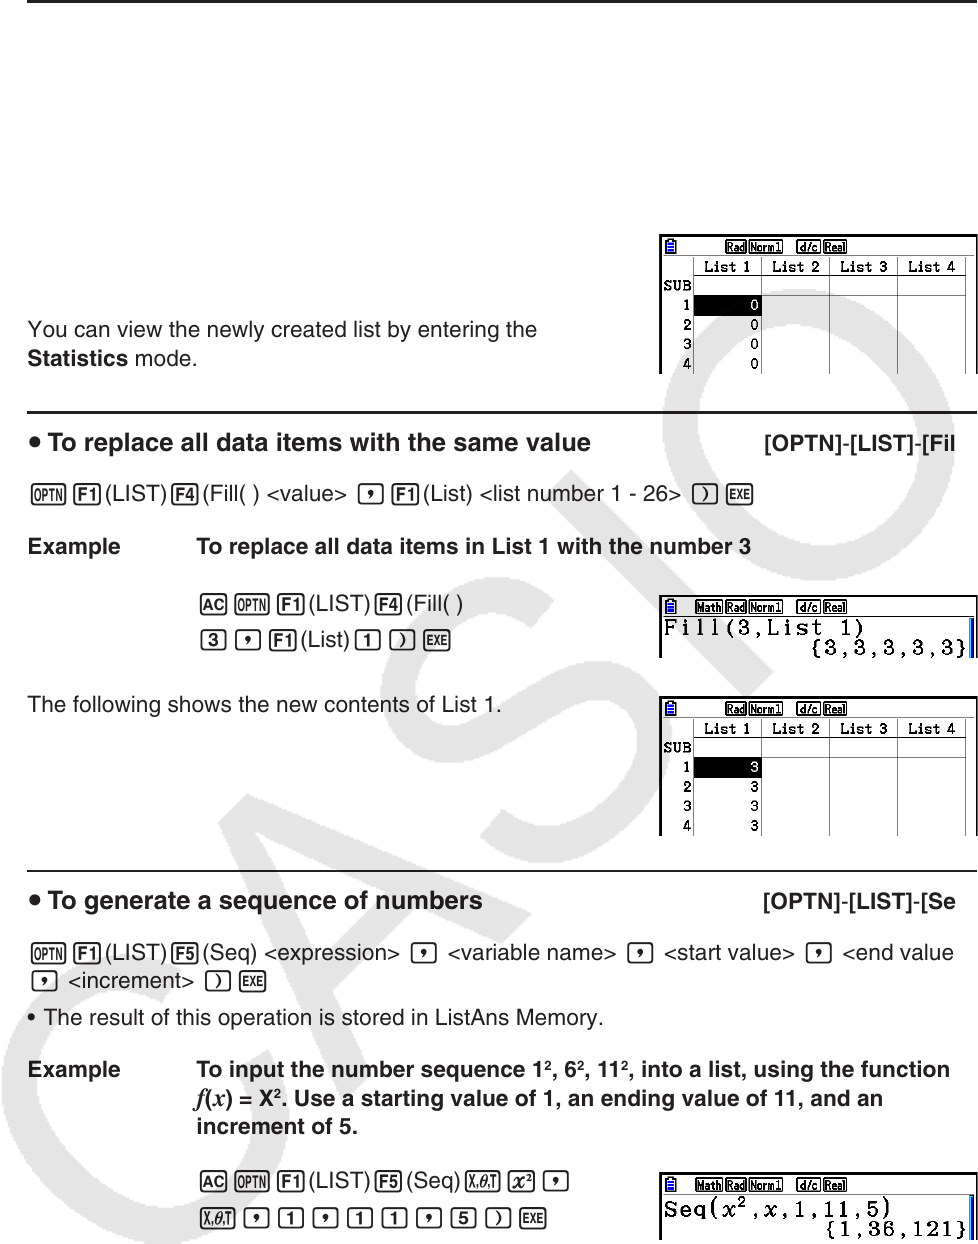
Example To replace all data items in List 1 with the number 3
AK1(LIST) 4(Fill( )
d,1(List) b)w
The following shows the new contents of List 1.
u To generate a sequence of numbers [OPTN] - [LIST] - [Seq]
K1(LIST) 5(Seq) <expression> , <variable name> , <start value> , <end value>
, <increment> )w
• The result of this operation is stored in ListAns Memory.
Example To input the number sequence 1
2
, 6
2
, 11
2
, into a list, using the function
f ( x ) = X
2
. Use a starting value of 1, an ending value of 11, and an
increment of 5.
AK1(LIST) 5(Seq) vx,
v,b,bb,f)w
Specifying an ending value of 12, 13, 14, or 15 produces the same result as shown above
since they are less than the value produced by the next increment (16).