
User Manual


6-44
After setting all the parameters, use c to move the highlighting to “Execute” and then press
one of the function keys shown below to perform the calculation or draw the graph.
• 1(CALC) ... Performs the calculation.
• 6(DRAW) ... Draws the graph (Two-Way ANOVA only).
Calculation results are displayed in table form, just as they appear in science books.
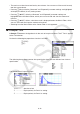
Data and Calculation Result Example
One-Way ANOVA Two-Way ANOVA
Data List1={1,1,2,2}
List2={124,913,120,1001}
List1={1,1,1,1,2,2,2,2}
List2={1,1,2,2,1,1,2,2}
List3={113,116,139,132,133,131,126,122}
Setup
Screen
Calculation
Result
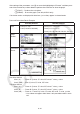
One-Way ANOVA
Line 1 (A) .......... Factor A
df value, SS value, MS value, F value, p-value
Line 2 (ERR) ..... Error
df value, SS value, MS value
Two-Way ANOVA
Line 1 (A) .......... Factor A
df value, SS value, MS value, F value, p-value
Line 2 (B) .......... Factor B
df value, SS value, MS value, F value, p-value
Line 3 (AB) ........ Factor A × Factor B
df value, SS value, MS value, F value, p-value
* Line 3 does not appear when there is only one observation in each
cell.