
User manual - fx-9860GII_Soft
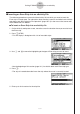
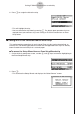


Table Of Contents
- Indhold
- Kom hurtigt i gang — Læs dette først!
- Kapitel 1 Grundlæggende funktioner
- Kapitel 2 Manuelle beregninger
- 1. Grundlæggende beregninger
- 2. Specielle funktioner
- 3. Angivelse af vinkelenhed og visningsformat
- 4. Funktionsberegninger
- 5. Numeriske beregninger
- 6. Beregninger med komplekse tal
- 7. Binære, oktale, decimale og heksadecimale beregninger med heltal
- 8. Matrixberegninger
- 9. Beregninger af metriske omregninger
- Kapitel 3 Funktionen List
- Kapitel 4 Ligningsregning
- Kapitel 5 Tegning af grafer
- 1. Grafeksempler
- 2. Håndtering af et grafskærmbillede
- 3. Tegning af en graf
- 4. Lagring af en graf i billedhukommelsen
- 5. Tegning af to grafer i det samme skærmbillede
- 6. Manuel tegning af grafer
- 7. Brug af tabeller
- 8. Tegning af dynamiske grafer
- 9. Tegning af en graf for en rekursionsformel
- 10. Tegning af et keglesnit
- 11. Ændring af en grafs udseende
- 12. Funktionsanalyse
- Kapitel 6 Statistiske grafer og beregninger
- 1. Før udførelse af statistiske beregninger
- 2. Beregning og tegning af en graf for statistiske data med én variabel
- 3. Beregning og tegning af en graf for statistiske data med to variable
- 4. Udførelse af statistiske beregninger
- 5. Test
- 6. Konfidensinterval
- 7. Fordeling
- 8. Input- og Output-udtryk til tests, konfidensinterval, og fordeling
- 9. Statistisk formel
- Kapitel 7 Økonomiske beregninger (TVM)
- Kapitel 8 Programmering
- Kapitel 9 Regneark
- Kapitel 10 eActivity
- Kapitel 11 Hukommelsesstyring
- Kapitel 12 Systemstyring
- Kapitel 13 Datakommunikation
- Kapitel 14 Brug af SD-kort (kun fx-9860GII SD)
- Appendiks
- E-CON2 Application (English)
- 1 E-CON2 Overview
- 2 Using the Setup Wizard
- 3 Using Advanced Setup
- 4 Using a Custom Probe
- 5 Using the MULTIMETER Mode
- 6 Using Setup Memory
- 7 Using Program Converter
- 8 Starting a Sampling Operation
- 9 Using Sample Data Memory
- 10 Using the Graph Analysis Tools to Graph Data
- 11 Graph Analysis Tool Graph Screen Operations
- 12 Calling E-CON2 Functions from an eActivity

20051101
8. Press w.
• This will set up the EA-200 in accordance with the setup data registered in the Econ
Sampling strip. The message “Start sampling?” appears on the screen after EA-200 set
up is complete.
9. Press w to start sampling.
• The screens that appear while sampling is in progress and after sampling is complete
depend on setup details. For more information, see “Starting a Sampling Operation”
(page 8-1).
• After sampling is complete, the data will be graphed in accordance with the setup
settings.
10.To return to the eActivity workspace screen from the graph screen, press !a(').
uu
uu
u To graph sampled data from an Econ Graph strip
1. On the eActivity workspace screen, use the f and c keys to move the highlighting to
the Econ Graph strip.
2. Press w.
• If this Econ Graph strip already has sampled data registered to it because of a previous
execution, a graph of the existing data will appear on the display. In this case, jump to
step 5 of this procedure.
• If this is the first time you are executing this Econ Graph strip, the Advanced Setup
screen will appear on the display. If this happens, proceed with step 3 of this procedure.
3. Perform steps 4 and 5 under “To configure an EA-200 setup using Advanced Setup (page
3-1) to configure the setup for sampling.
4. Press 1(STRT).
• As instructed by the message that appears on the display, press the w key to perform
sampling.
• After sampling is complete, the data will be graphed in accordance with the setup
settings.
5. To return to the eActivity workspace screen from the graph screen, press !a(').
12-6
Calling E-CON2 Functions from an eActivity