
User manual - fx-9860GII_Soft
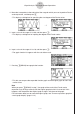
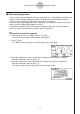

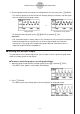
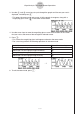
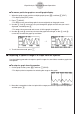
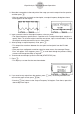
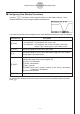
Table Of Contents
- Indhold
- Kom hurtigt i gang — Læs dette først!
- Kapitel 1 Grundlæggende funktioner
- Kapitel 2 Manuelle beregninger
- 1. Grundlæggende beregninger
- 2. Specielle funktioner
- 3. Angivelse af vinkelenhed og visningsformat
- 4. Funktionsberegninger
- 5. Numeriske beregninger
- 6. Beregninger med komplekse tal
- 7. Binære, oktale, decimale og heksadecimale beregninger med heltal
- 8. Matrixberegninger
- 9. Beregninger af metriske omregninger
- Kapitel 3 Funktionen List
- Kapitel 4 Ligningsregning
- Kapitel 5 Tegning af grafer
- 1. Grafeksempler
- 2. Håndtering af et grafskærmbillede
- 3. Tegning af en graf
- 4. Lagring af en graf i billedhukommelsen
- 5. Tegning af to grafer i det samme skærmbillede
- 6. Manuel tegning af grafer
- 7. Brug af tabeller
- 8. Tegning af dynamiske grafer
- 9. Tegning af en graf for en rekursionsformel
- 10. Tegning af et keglesnit
- 11. Ændring af en grafs udseende
- 12. Funktionsanalyse
- Kapitel 6 Statistiske grafer og beregninger
- 1. Før udførelse af statistiske beregninger
- 2. Beregning og tegning af en graf for statistiske data med én variabel
- 3. Beregning og tegning af en graf for statistiske data med to variable
- 4. Udførelse af statistiske beregninger
- 5. Test
- 6. Konfidensinterval
- 7. Fordeling
- 8. Input- og Output-udtryk til tests, konfidensinterval, og fordeling
- 9. Statistisk formel
- Kapitel 7 Økonomiske beregninger (TVM)
- Kapitel 8 Programmering
- Kapitel 9 Regneark
- Kapitel 10 eActivity
- Kapitel 11 Hukommelsesstyring
- Kapitel 12 Systemstyring
- Kapitel 13 Datakommunikation
- Kapitel 14 Brug af SD-kort (kun fx-9860GII SD)
- Appendiks
- E-CON2 Application (English)
- 1 E-CON2 Overview
- 2 Using the Setup Wizard
- 3 Using Advanced Setup
- 4 Using a Custom Probe
- 5 Using the MULTIMETER Mode
- 6 Using Setup Memory
- 7 Using Program Converter
- 8 Starting a Sampling Operation
- 9 Using Sample Data Memory
- 10 Using the Graph Analysis Tools to Graph Data
- 11 Graph Analysis Tool Graph Screen Operations
- 12 Calling E-CON2 Functions from an eActivity
20051101
11-14
Graph Analysis Tool Graph Screen Operations
k Configuring View Window Parameters
Pressing !3(V-Window) while the graph screen is on the display displays a View
Window function key menu along the bottom of the display.
Press the function key that corresponds to the View Window parameter you want to configure.
20070101
To exit the View Window function key menu and return to the standard function key menu,
press J.
1
(
Auto
)
DescriptionFunction Key
Automatically applies the following View Window parameters.
Y-axis Elements: In accordance with screen size
X-axis Elements: In accordance with screen size when 1 data item
equals 1 dot; 1 data equals 1 dot in other cases
Resizes the graph so all of it fits in the screen along the Y-axis, without
changing the X-axis dimensions.
Specifies the unit of the numeric axis grid displayed by the Econ Axes
setting of the graph setup screen (page 3-13).
1(μ sec): microseconds
2(msec): milliseconds
3(sec): seconds
4(DHMS):days, hours, minutes, seconds (1 day, 2 hours, 30 minutes,
5 seconds = 1d2h30m5s)
5(Auto):Auto selection
Toggles display of the source data on the graph screen on and off.
2
(
FULL
)
3(Y)
4(UNIT)
5(CHNG)
Resizes the graph so all of it fits in the screen.