
User manual - fx-9860GII_Soft
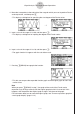
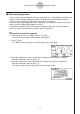

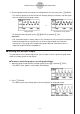
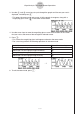
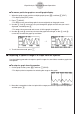
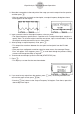
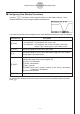
Table Of Contents
- Indhold
- Kom hurtigt i gang — Læs dette først!
- Kapitel 1 Grundlæggende funktioner
- Kapitel 2 Manuelle beregninger
- 1. Grundlæggende beregninger
- 2. Specielle funktioner
- 3. Angivelse af vinkelenhed og visningsformat
- 4. Funktionsberegninger
- 5. Numeriske beregninger
- 6. Beregninger med komplekse tal
- 7. Binære, oktale, decimale og heksadecimale beregninger med heltal
- 8. Matrixberegninger
- 9. Beregninger af metriske omregninger
- Kapitel 3 Funktionen List
- Kapitel 4 Ligningsregning
- Kapitel 5 Tegning af grafer
- 1. Grafeksempler
- 2. Håndtering af et grafskærmbillede
- 3. Tegning af en graf
- 4. Lagring af en graf i billedhukommelsen
- 5. Tegning af to grafer i det samme skærmbillede
- 6. Manuel tegning af grafer
- 7. Brug af tabeller
- 8. Tegning af dynamiske grafer
- 9. Tegning af en graf for en rekursionsformel
- 10. Tegning af et keglesnit
- 11. Ændring af en grafs udseende
- 12. Funktionsanalyse
- Kapitel 6 Statistiske grafer og beregninger
- 1. Før udførelse af statistiske beregninger
- 2. Beregning og tegning af en graf for statistiske data med én variabel
- 3. Beregning og tegning af en graf for statistiske data med to variable
- 4. Udførelse af statistiske beregninger
- 5. Test
- 6. Konfidensinterval
- 7. Fordeling
- 8. Input- og Output-udtryk til tests, konfidensinterval, og fordeling
- 9. Statistisk formel
- Kapitel 7 Økonomiske beregninger (TVM)
- Kapitel 8 Programmering
- Kapitel 9 Regneark
- Kapitel 10 eActivity
- Kapitel 11 Hukommelsesstyring
- Kapitel 12 Systemstyring
- Kapitel 13 Datakommunikation
- Kapitel 14 Brug af SD-kort (kun fx-9860GII SD)
- Appendiks
- E-CON2 Application (English)
- 1 E-CON2 Overview
- 2 Using the Setup Wizard
- 3 Using Advanced Setup
- 4 Using a Custom Probe
- 5 Using the MULTIMETER Mode
- 6 Using Setup Memory
- 7 Using Program Converter
- 8 Starting a Sampling Operation
- 9 Using Sample Data Memory
- 10 Using the Graph Analysis Tools to Graph Data
- 11 Graph Analysis Tool Graph Screen Operations
- 12 Calling E-CON2 Functions from an eActivity
20051101
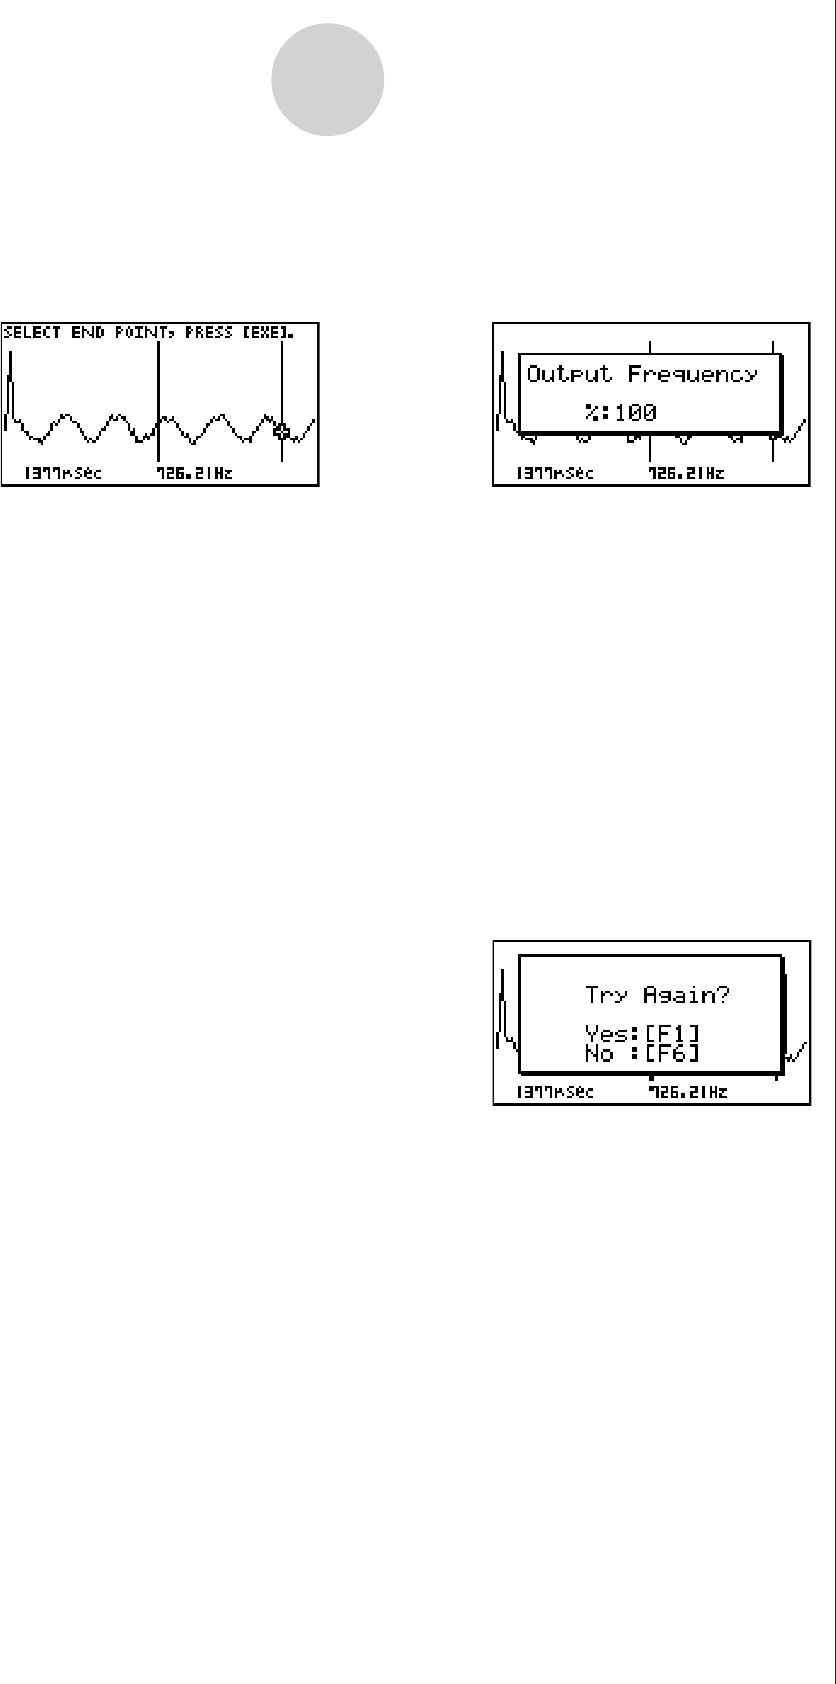
4. Input a percent value for the output frequency value you want.
• The output frequency specification is a percent value. To output the original sound as-is,
specify 100%. To raise the original sound by one octave, input a value of 200%. To lower
the original sound by one octave, input a value of 50%.
5. After inputting an output frequency value, press w.
• This outputs the waveform between the start point and end point from the EA-200
speaker.
• If the sound you configured cannot be output for some reason, the message “Range
Error” will appear. If this happens, press J to scroll back through the previous setting
screens and change the setup as required.
6. To terminate sound output, press the EA-200 [START/STOP] key.
7. Press w.
• This displays a screen like the one shown below.
/
3. Move the trace pointer to the end point of the range you want to output from the speaker,
and then press w.
• After you specify the start point and end point, an output frequency dialog box shown
below appears on the display.
11-13
Graph Analysis Tool Graph Screen Operations
8. If you want to retry output from the speaker, press 1(Yes). To exit the procedure and
return to the graph screen, press 6(No).
• Pressing 1(Yes) returns to the “Output Frequency” dialog box. From there, repeat the
above steps from step 4.