
User manual - fx-9860GII_Soft
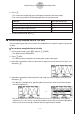
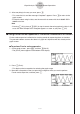
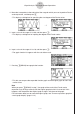

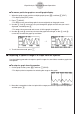
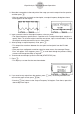
Table Of Contents
- Indhold
- Kom hurtigt i gang — Læs dette først!
- Kapitel 1 Grundlæggende funktioner
- Kapitel 2 Manuelle beregninger
- 1. Grundlæggende beregninger
- 2. Specielle funktioner
- 3. Angivelse af vinkelenhed og visningsformat
- 4. Funktionsberegninger
- 5. Numeriske beregninger
- 6. Beregninger med komplekse tal
- 7. Binære, oktale, decimale og heksadecimale beregninger med heltal
- 8. Matrixberegninger
- 9. Beregninger af metriske omregninger
- Kapitel 3 Funktionen List
- Kapitel 4 Ligningsregning
- Kapitel 5 Tegning af grafer
- 1. Grafeksempler
- 2. Håndtering af et grafskærmbillede
- 3. Tegning af en graf
- 4. Lagring af en graf i billedhukommelsen
- 5. Tegning af to grafer i det samme skærmbillede
- 6. Manuel tegning af grafer
- 7. Brug af tabeller
- 8. Tegning af dynamiske grafer
- 9. Tegning af en graf for en rekursionsformel
- 10. Tegning af et keglesnit
- 11. Ændring af en grafs udseende
- 12. Funktionsanalyse
- Kapitel 6 Statistiske grafer og beregninger
- 1. Før udførelse af statistiske beregninger
- 2. Beregning og tegning af en graf for statistiske data med én variabel
- 3. Beregning og tegning af en graf for statistiske data med to variable
- 4. Udførelse af statistiske beregninger
- 5. Test
- 6. Konfidensinterval
- 7. Fordeling
- 8. Input- og Output-udtryk til tests, konfidensinterval, og fordeling
- 9. Statistisk formel
- Kapitel 7 Økonomiske beregninger (TVM)
- Kapitel 8 Programmering
- Kapitel 9 Regneark
- Kapitel 10 eActivity
- Kapitel 11 Hukommelsesstyring
- Kapitel 12 Systemstyring
- Kapitel 13 Datakommunikation
- Kapitel 14 Brug af SD-kort (kun fx-9860GII SD)
- Appendiks
- E-CON2 Application (English)
- 1 E-CON2 Overview
- 2 Using the Setup Wizard
- 3 Using Advanced Setup
- 4 Using a Custom Probe
- 5 Using the MULTIMETER Mode
- 6 Using Setup Memory
- 7 Using Program Converter
- 8 Starting a Sampling Operation
- 9 Using Sample Data Memory
- 10 Using the Graph Analysis Tools to Graph Data
- 11 Graph Analysis Tool Graph Screen Operations
- 12 Calling E-CON2 Functions from an eActivity
20051101
3. Press w.
• This causes the magnifying glass to disappear and enters the zoom mode.
• The cursor keys perform the following operations in the zoom mode.
4. To exit the zoom mode, press J.
k Transforming Sampled Data to List Data
Use the following procedure to transform the sampled data in a specific range of a graph into
list data.
uu
uu
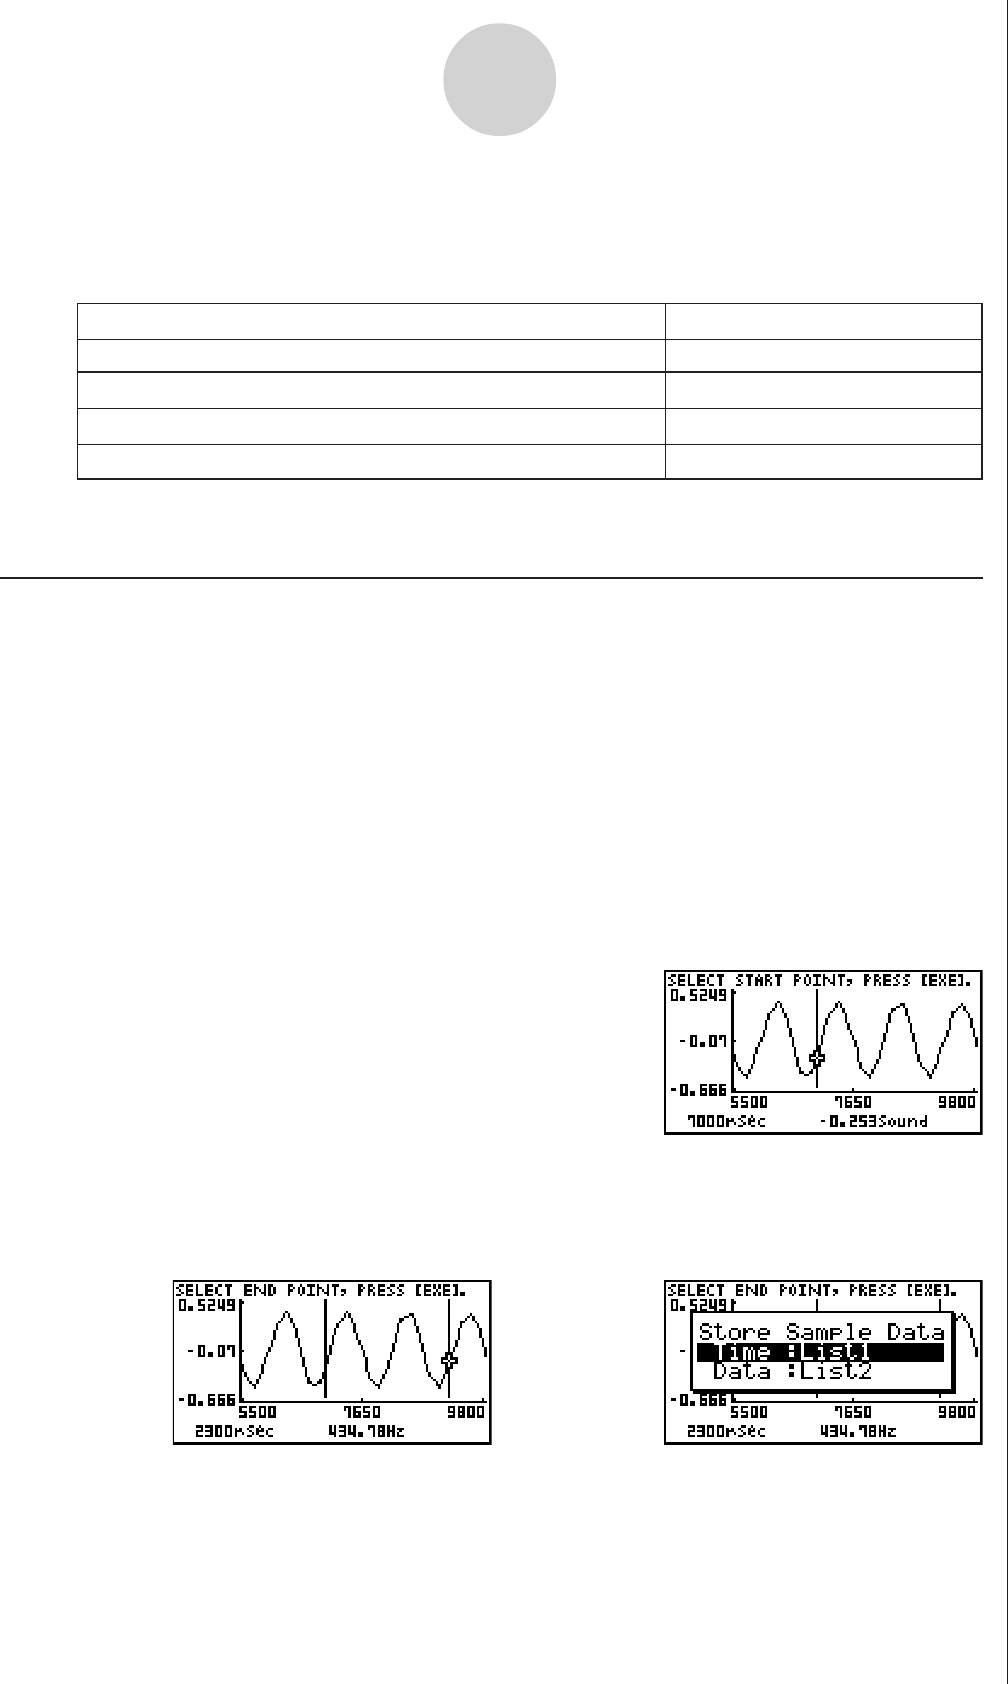
u To transform sampled data to list data
1. On the graph screen, press K, and then 2(LMEM).
• This displays the [LMEM] menu.
2. Press 2(SEL).
• This displays the trace pointer for selecting the range on the graph.
3. Move the trace pointer to the start point of the range you want to convert to list data, and
then press w.
11-5
Graph Analysis Tool Graph Screen Operations
To do this: Press this cursor key:
Reduce the size of the graph image horizontally d
Enlarge the graph image horizontally e
Reduce the size of the graph image vertically c
Enlarge the graph image vertically f
4. Move the trace pointer to the end point of the range you want to convert to list data, and
then press w.
• This displays a dialog box for specifying the lists where you want to store the time data
and the sampled data.
/
• The initial default lists are List 1 for the time and List 2 for sample data. To change to
another list (List 1 to List 26), use the up and down cursor keys to move the highlighting
to the list you want to change, and then input the applicable list number.