
User manual - fx-9860GII_Soft
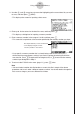
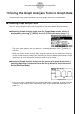
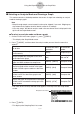
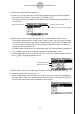
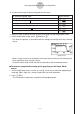
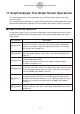
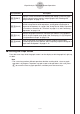
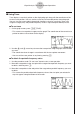
Table Of Contents
- Indhold
- Kom hurtigt i gang — Læs dette først!
- Kapitel 1 Grundlæggende funktioner
- Kapitel 2 Manuelle beregninger
- 1. Grundlæggende beregninger
- 2. Specielle funktioner
- 3. Angivelse af vinkelenhed og visningsformat
- 4. Funktionsberegninger
- 5. Numeriske beregninger
- 6. Beregninger med komplekse tal
- 7. Binære, oktale, decimale og heksadecimale beregninger med heltal
- 8. Matrixberegninger
- 9. Beregninger af metriske omregninger
- Kapitel 3 Funktionen List
- Kapitel 4 Ligningsregning
- Kapitel 5 Tegning af grafer
- 1. Grafeksempler
- 2. Håndtering af et grafskærmbillede
- 3. Tegning af en graf
- 4. Lagring af en graf i billedhukommelsen
- 5. Tegning af to grafer i det samme skærmbillede
- 6. Manuel tegning af grafer
- 7. Brug af tabeller
- 8. Tegning af dynamiske grafer
- 9. Tegning af en graf for en rekursionsformel
- 10. Tegning af et keglesnit
- 11. Ændring af en grafs udseende
- 12. Funktionsanalyse
- Kapitel 6 Statistiske grafer og beregninger
- 1. Før udførelse af statistiske beregninger
- 2. Beregning og tegning af en graf for statistiske data med én variabel
- 3. Beregning og tegning af en graf for statistiske data med to variable
- 4. Udførelse af statistiske beregninger
- 5. Test
- 6. Konfidensinterval
- 7. Fordeling
- 8. Input- og Output-udtryk til tests, konfidensinterval, og fordeling
- 9. Statistisk formel
- Kapitel 7 Økonomiske beregninger (TVM)
- Kapitel 8 Programmering
- Kapitel 9 Regneark
- Kapitel 10 eActivity
- Kapitel 11 Hukommelsesstyring
- Kapitel 12 Systemstyring
- Kapitel 13 Datakommunikation
- Kapitel 14 Brug af SD-kort (kun fx-9860GII SD)
- Appendiks
- E-CON2 Application (English)
- 1 E-CON2 Overview
- 2 Using the Setup Wizard
- 3 Using Advanced Setup
- 4 Using a Custom Probe
- 5 Using the MULTIMETER Mode
- 6 Using Setup Memory
- 7 Using Program Converter
- 8 Starting a Sampling Operation
- 9 Using Sample Data Memory
- 10 Using the Graph Analysis Tools to Graph Data
- 11 Graph Analysis Tool Graph Screen Operations
- 12 Calling E-CON2 Functions from an eActivity
20051101
4. Press w to assign the period and periodic frequency values to Alpha-Memory variables.
• This displays a dialog box for specifying variable names for [Period] and [Frequency]
values.
• The initial default variable name settings are “S” for the period and “H” for the periodic
frequency. To change to another variable name, use the up and down cursor keys to
move the highlighting to the item you want to change, and then press the applicable
letter key.
5. After everything is the way you want, press w.
• This stores the values and exits the trace operation.
• For details about using Alpha-Memory, see the manual that comes with the fx-9860G
SD/fx-9860G calculator.
k Using Zoom
Zoom lets you enlarge or reduce the size of the graph along the x-axis or the y-axis.
Note
• When there are multiple graphs on the screen, the procedure below zooms all of them.
For information about zooming a particular graph when there are multiple graphs on the
screen, see “Working with Multiple Graphs” on page 11-10.
uu
uu
u
To zoom the graph screen
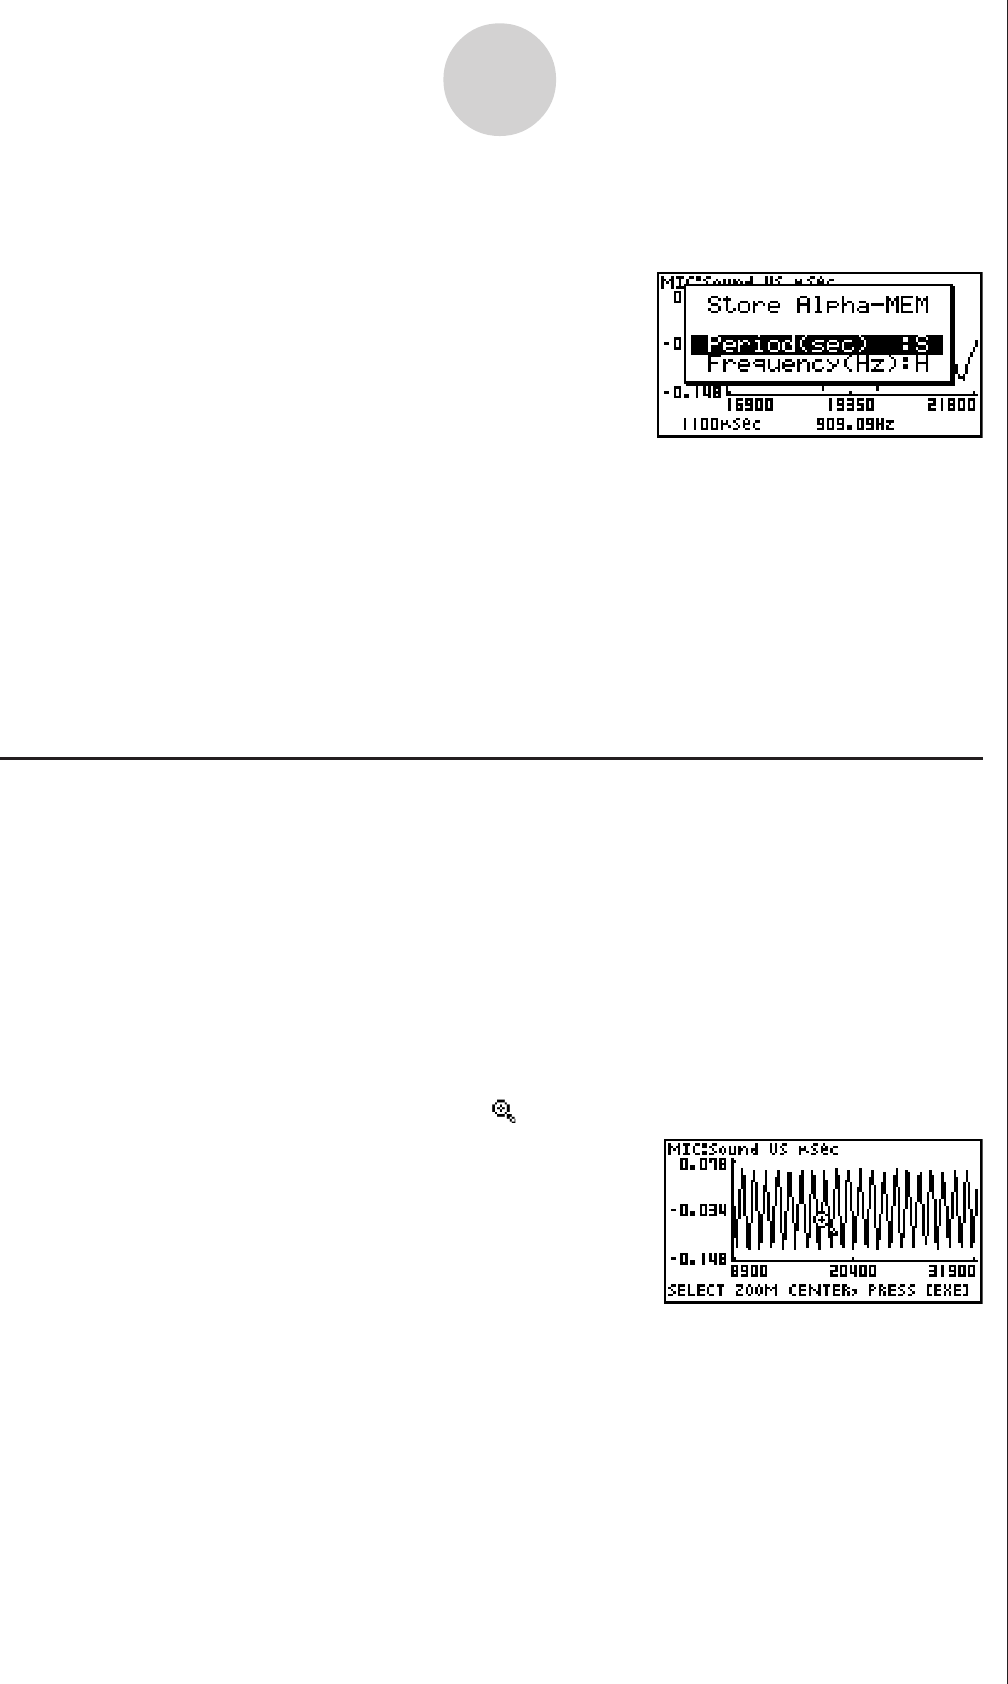
1. On the graph screen, press !2(ZOOM).
• This causes a magnifying glass cursor ( ) to appear in the center of the screen.
11-4
Graph Analysis Tool Graph Screen Operations
2. Use the cursor keys to move the magnifying glass cursor to the location on the screen
that you want at the center of the enlarged or reduced screen.