
User manual - fx-9860GII_Soft
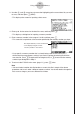
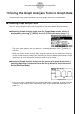
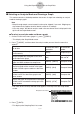
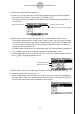
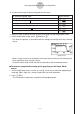
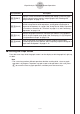
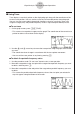
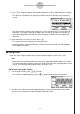
Table Of Contents
- Indhold
- Kom hurtigt i gang — Læs dette først!
- Kapitel 1 Grundlæggende funktioner
- Kapitel 2 Manuelle beregninger
- 1. Grundlæggende beregninger
- 2. Specielle funktioner
- 3. Angivelse af vinkelenhed og visningsformat
- 4. Funktionsberegninger
- 5. Numeriske beregninger
- 6. Beregninger med komplekse tal
- 7. Binære, oktale, decimale og heksadecimale beregninger med heltal
- 8. Matrixberegninger
- 9. Beregninger af metriske omregninger
- Kapitel 3 Funktionen List
- Kapitel 4 Ligningsregning
- Kapitel 5 Tegning af grafer
- 1. Grafeksempler
- 2. Håndtering af et grafskærmbillede
- 3. Tegning af en graf
- 4. Lagring af en graf i billedhukommelsen
- 5. Tegning af to grafer i det samme skærmbillede
- 6. Manuel tegning af grafer
- 7. Brug af tabeller
- 8. Tegning af dynamiske grafer
- 9. Tegning af en graf for en rekursionsformel
- 10. Tegning af et keglesnit
- 11. Ændring af en grafs udseende
- 12. Funktionsanalyse
- Kapitel 6 Statistiske grafer og beregninger
- 1. Før udførelse af statistiske beregninger
- 2. Beregning og tegning af en graf for statistiske data med én variabel
- 3. Beregning og tegning af en graf for statistiske data med to variable
- 4. Udførelse af statistiske beregninger
- 5. Test
- 6. Konfidensinterval
- 7. Fordeling
- 8. Input- og Output-udtryk til tests, konfidensinterval, og fordeling
- 9. Statistisk formel
- Kapitel 7 Økonomiske beregninger (TVM)
- Kapitel 8 Programmering
- Kapitel 9 Regneark
- Kapitel 10 eActivity
- Kapitel 11 Hukommelsesstyring
- Kapitel 12 Systemstyring
- Kapitel 13 Datakommunikation
- Kapitel 14 Brug af SD-kort (kun fx-9860GII SD)
- Appendiks
- E-CON2 Application (English)
- 1 E-CON2 Overview
- 2 Using the Setup Wizard
- 3 Using Advanced Setup
- 4 Using a Custom Probe
- 5 Using the MULTIMETER Mode
- 6 Using Setup Memory
- 7 Using Program Converter
- 8 Starting a Sampling Operation
- 9 Using Sample Data Memory
- 10 Using the Graph Analysis Tools to Graph Data
- 11 Graph Analysis Tool Graph Screen Operations
- 12 Calling E-CON2 Functions from an eActivity

20051101
11-1
Graph Analysis Tool Graph Screen Operations
11
Graph Analysis Tool Graph Screen Operations
This section explains the various operations you can perform on the graph screen after
drawing a graph.
You can perform these operations on a graph screen produced by a sampling operation, or by the
operation described under “Selecting an Analysis Mode and Drawing a Graph” on page 10-2.
k Graph Screen Key Operations
On the graph screen, you can use the keys described in the table below to analyze (CALC)
graphs by reading data points along the graph (Trace) and enlarging specific parts of the
graph (Zoom).
!1
(TRCE)
DescriptionKey Operation
Displays a trace pointer on the graph along with the coordinates of the
current cursor location. Trace can also be used to obtain the periodic
frequency of a specific range on the graph and assign it to a variable.
See “Using Trace” on page 11-3.
Displays a function menu of special View Window commands for the
E-CON2 Mode graph screen.
For details about each command, see “Configuring View Window
Parameters” on page 11-14.
!2
(ZOOM)
!3(V-WIN)
Starts a zoom operation, which you can use to enlarge or reduce the
size of the graph along the
x-axis or the y-axis. See “Using Zoom” on
page 11-4.
K1
(
PICT
)
Saves the currently displayed graph as a graphic image. You can recall a
saved graph image and overlay it on another graph to compare them.
For details about these procedures, see “5-4 Storing a Graph in Picture
Memory” in the manual that comes with the fx-9860G SD/fx-9860G
calculator.
K2
(
LMEM
)
Displays a menu of functions for saving the sample values in a specific
range of a graph to a list. See “Transforming Sampled Data to List Data”
on page 11-5.
Displays a menu that contains the following commands: Cls, Plot,
F-Line, Text, PEN, Vert, and Hztl. For details about each command, see
“5-10 Changing the Appearance of a Graph” in the manual that comes
with the fx-9860G SD/fx-9860G calculator.
!4(SKTCH)
20070101