
User manual - fx-9860GII_Soft


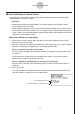

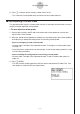
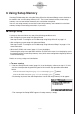
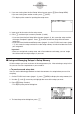

Table Of Contents
- Indhold
- Kom hurtigt i gang — Læs dette først!
- Kapitel 1 Grundlæggende funktioner
- Kapitel 2 Manuelle beregninger
- 1. Grundlæggende beregninger
- 2. Specielle funktioner
- 3. Angivelse af vinkelenhed og visningsformat
- 4. Funktionsberegninger
- 5. Numeriske beregninger
- 6. Beregninger med komplekse tal
- 7. Binære, oktale, decimale og heksadecimale beregninger med heltal
- 8. Matrixberegninger
- 9. Beregninger af metriske omregninger
- Kapitel 3 Funktionen List
- Kapitel 4 Ligningsregning
- Kapitel 5 Tegning af grafer
- 1. Grafeksempler
- 2. Håndtering af et grafskærmbillede
- 3. Tegning af en graf
- 4. Lagring af en graf i billedhukommelsen
- 5. Tegning af to grafer i det samme skærmbillede
- 6. Manuel tegning af grafer
- 7. Brug af tabeller
- 8. Tegning af dynamiske grafer
- 9. Tegning af en graf for en rekursionsformel
- 10. Tegning af et keglesnit
- 11. Ændring af en grafs udseende
- 12. Funktionsanalyse
- Kapitel 6 Statistiske grafer og beregninger
- 1. Før udførelse af statistiske beregninger
- 2. Beregning og tegning af en graf for statistiske data med én variabel
- 3. Beregning og tegning af en graf for statistiske data med to variable
- 4. Udførelse af statistiske beregninger
- 5. Test
- 6. Konfidensinterval
- 7. Fordeling
- 8. Input- og Output-udtryk til tests, konfidensinterval, og fordeling
- 9. Statistisk formel
- Kapitel 7 Økonomiske beregninger (TVM)
- Kapitel 8 Programmering
- Kapitel 9 Regneark
- Kapitel 10 eActivity
- Kapitel 11 Hukommelsesstyring
- Kapitel 12 Systemstyring
- Kapitel 13 Datakommunikation
- Kapitel 14 Brug af SD-kort (kun fx-9860GII SD)
- Appendiks
- E-CON2 Application (English)
- 1 E-CON2 Overview
- 2 Using the Setup Wizard
- 3 Using Advanced Setup
- 4 Using a Custom Probe
- 5 Using the MULTIMETER Mode
- 6 Using Setup Memory
- 7 Using Program Converter
- 8 Starting a Sampling Operation
- 9 Using Sample Data Memory
- 10 Using the Graph Analysis Tools to Graph Data
- 11 Graph Analysis Tool Graph Screen Operations
- 12 Calling E-CON2 Functions from an eActivity
20051101
4-4
Using a Custom Probe
4. After the sampled value stabilizes, hold down w for a few seconds.
• This will register the first sampled value and display it on the screen. At this time the
cursor will appear at the bottom of the display, ready for input of a reference value.
5. Use the key pad to input the reference value for the first sampled value, and then press
w.
• This cause sampling of the second value to be performed automatically, and display the
same type of screen that appeared in step 3.
6. After the sampled value stabilizes, hold down w for a few seconds.
• This will register the second sampled value and display it on the screen. The cursor will
appear at the bottom of the display, ready for input of a reference value.
Second sampling operation
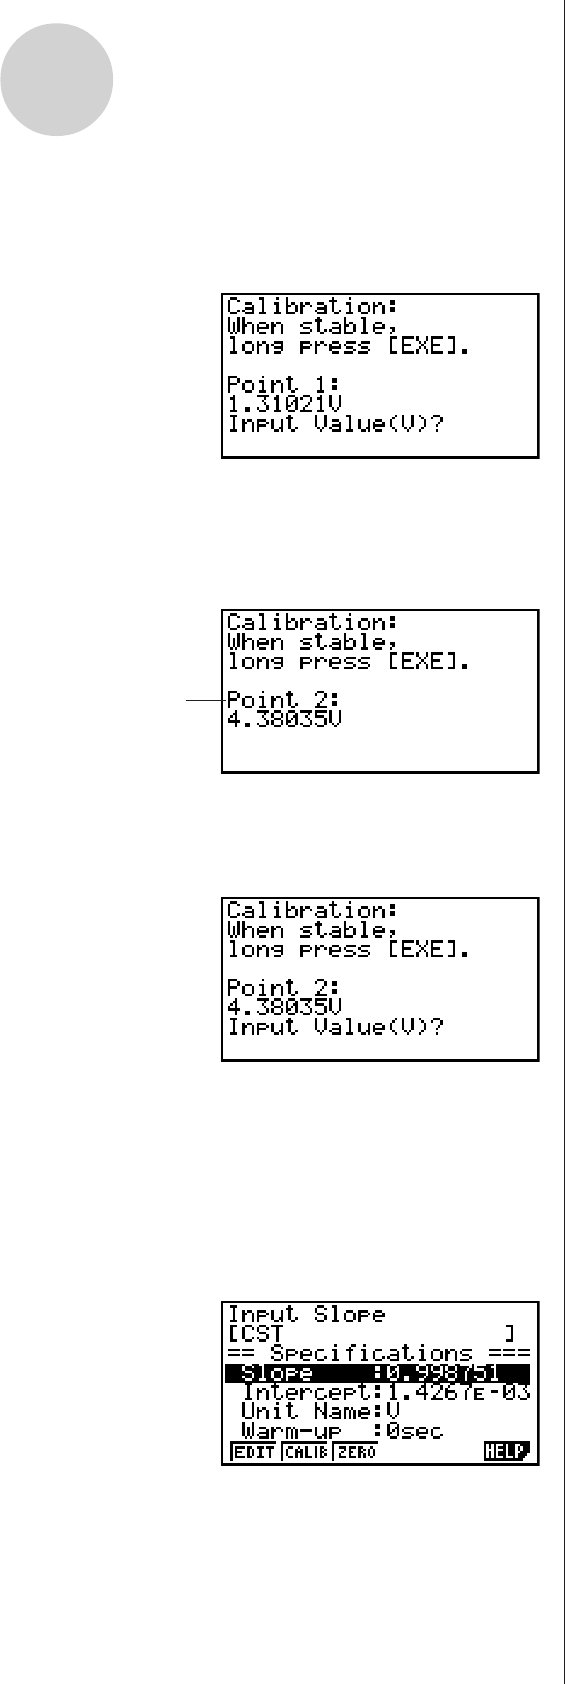
7. Use the key pad to input the reference value for the second sampled value, and then
press w.
• This will return to the custom probe setup screen.
• The E-CON2 will calculate the slope and intercept value based on the two reference
values that you input, and configure the settings automatically. The automatically
configured values will appear on the custom probe setup screen, where you can view
them.