
User manual - fx-9860GII_Soft

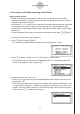

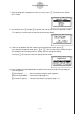
Table Of Contents
- Indhold
- Kom hurtigt i gang — Læs dette først!
- Kapitel 1 Grundlæggende funktioner
- Kapitel 2 Manuelle beregninger
- 1. Grundlæggende beregninger
- 2. Specielle funktioner
- 3. Angivelse af vinkelenhed og visningsformat
- 4. Funktionsberegninger
- 5. Numeriske beregninger
- 6. Beregninger med komplekse tal
- 7. Binære, oktale, decimale og heksadecimale beregninger med heltal
- 8. Matrixberegninger
- 9. Beregninger af metriske omregninger
- Kapitel 3 Funktionen List
- Kapitel 4 Ligningsregning
- Kapitel 5 Tegning af grafer
- 1. Grafeksempler
- 2. Håndtering af et grafskærmbillede
- 3. Tegning af en graf
- 4. Lagring af en graf i billedhukommelsen
- 5. Tegning af to grafer i det samme skærmbillede
- 6. Manuel tegning af grafer
- 7. Brug af tabeller
- 8. Tegning af dynamiske grafer
- 9. Tegning af en graf for en rekursionsformel
- 10. Tegning af et keglesnit
- 11. Ændring af en grafs udseende
- 12. Funktionsanalyse
- Kapitel 6 Statistiske grafer og beregninger
- 1. Før udførelse af statistiske beregninger
- 2. Beregning og tegning af en graf for statistiske data med én variabel
- 3. Beregning og tegning af en graf for statistiske data med to variable
- 4. Udførelse af statistiske beregninger
- 5. Test
- 6. Konfidensinterval
- 7. Fordeling
- 8. Input- og Output-udtryk til tests, konfidensinterval, og fordeling
- 9. Statistisk formel
- Kapitel 7 Økonomiske beregninger (TVM)
- Kapitel 8 Programmering
- Kapitel 9 Regneark
- Kapitel 10 eActivity
- Kapitel 11 Hukommelsesstyring
- Kapitel 12 Systemstyring
- Kapitel 13 Datakommunikation
- Kapitel 14 Brug af SD-kort (kun fx-9860GII SD)
- Appendiks
- E-CON2 Application (English)
- 1 E-CON2 Overview
- 2 Using the Setup Wizard
- 3 Using Advanced Setup
- 4 Using a Custom Probe
- 5 Using the MULTIMETER Mode
- 6 Using Setup Memory
- 7 Using Program Converter
- 8 Starting a Sampling Operation
- 9 Using Sample Data Memory
- 10 Using the Graph Analysis Tools to Graph Data
- 11 Graph Analysis Tool Graph Screen Operations
- 12 Calling E-CON2 Functions from an eActivity
20051101
2-3
Using the Setup Wizard
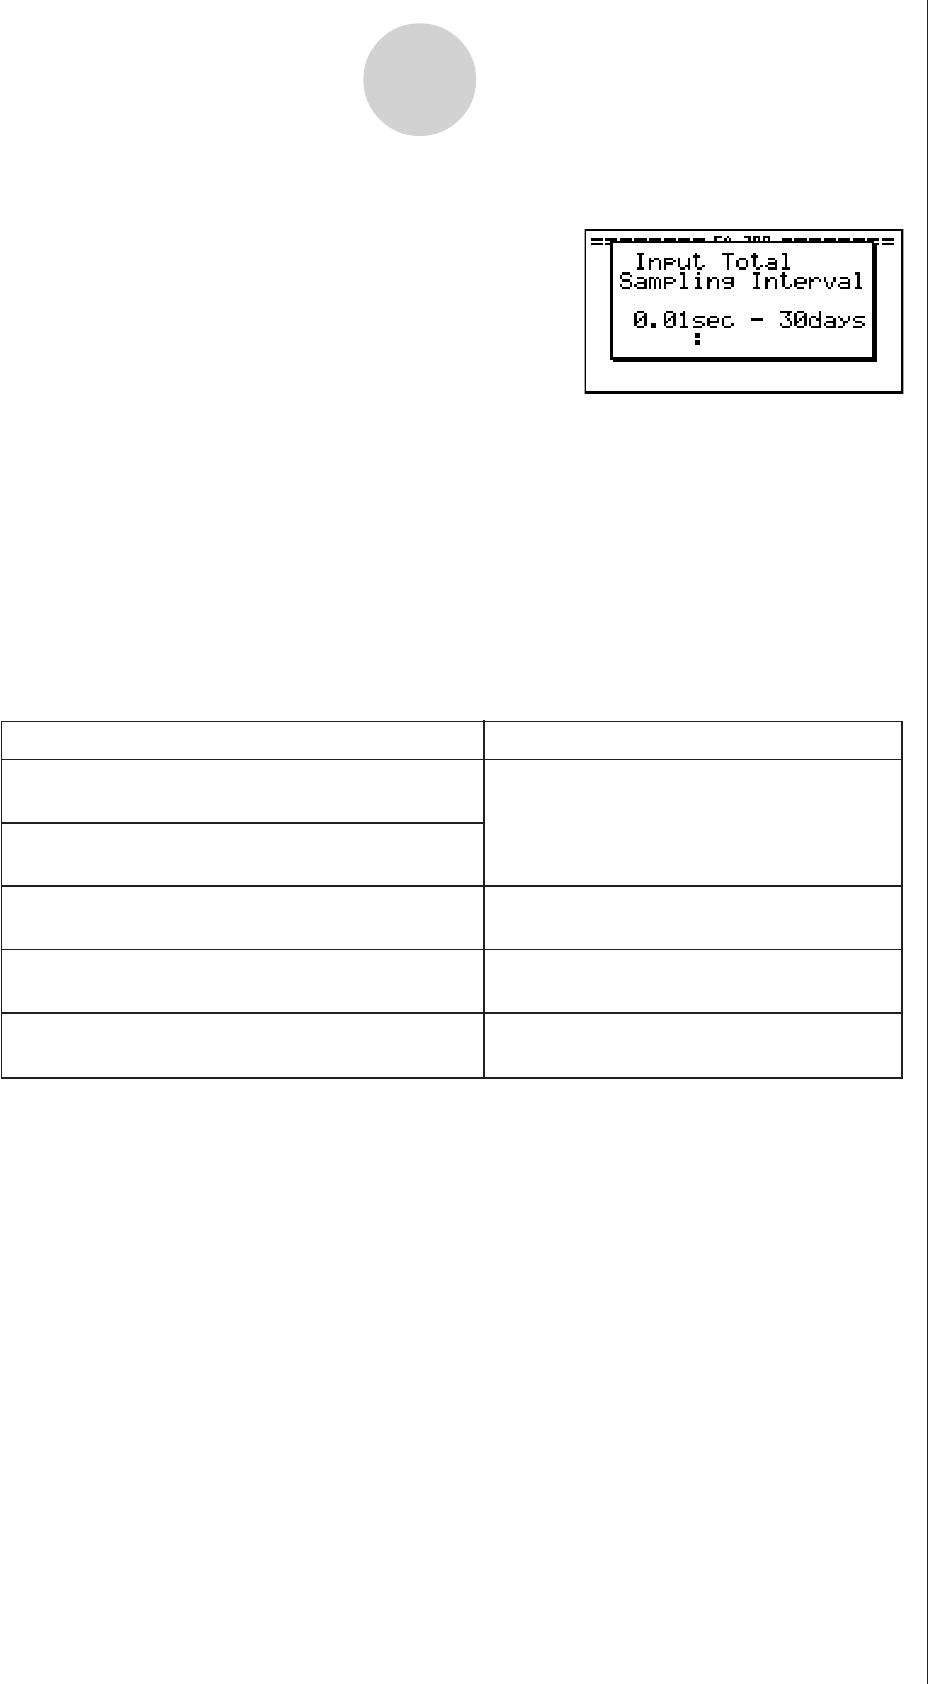
• If the “Input Total Sampling Interval” screen appears, skip to step 6.
5. Select the options for the sensor you specified in step 4.
Use the f and c cursor keys to move the highlighting to the option you want to select,
and then press w.
• If the “Input Total Sampling Interval” screen appears, advance to step 6.
Important!
When special settings are required by the sensor and/or option you select, other screens
other than the “Input Total Sampling Interval” screen will appear on the display. The
following shows where you should go to find information about the operations you need to
perform for each sensor/option selection.
6. Use the number input keys to input the total sampling time. Just input a value.
In step 8 of this procedure, you will be able to specify the unit (seconds, minutes, hours,
days) of the value you input here.
Note
• With some sensors ([CASIO] - [Microphone] - [Sound wave], etc.) sampling time is
limited to a few seconds. The unit for such a sensor is always seconds, and so the
“Select Unit” screen does not appear.
• If you specify a total sampling time value in the range of 10 seconds to 23 hours, 59
minutes, 59 seconds, real-time graphing will be performed during sampling. This is the
same as selecting the Realtime Mode on the “Advanced Setup” screen.
If you select this sensor/option: Go here for more information:
[CASIO] - [Microphone] - [Sound wave & FFT]
[CASIO] - [Microphone] - [FFT only]
[VERNIER] - [Photogate] - [Gate]
“To configure a setup for PhotoGate
alone” on page 2-6
[VERNIER] - [Photogate] - [Pulley]
“To configure a setup for PhotoGate
and Smart Pulley” on page 2-7
[CASIO] - [Speaker] - [y=f(x)]
“Outputting the Waveform of a Function
through the Speaker” on page 2-8
“Using Setup Wizard to Configure
Settings for FFT (Frequency
Characteristics) Data Sampling” on
page 2-5