
User manual - fx-9860GII_Soft


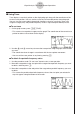

Table Of Contents
- Indhold
- Kom hurtigt i gang — Læs dette først!
- Kapitel 1 Grundlæggende funktioner
- Kapitel 2 Manuelle beregninger
- 1. Grundlæggende beregninger
- 2. Specielle funktioner
- 3. Angivelse af vinkelenhed og visningsformat
- 4. Funktionsberegninger
- 5. Numeriske beregninger
- 6. Beregninger med komplekse tal
- 7. Binære, oktale, decimale og heksadecimale beregninger med heltal
- 8. Matrixberegninger
- 9. Beregninger af metriske omregninger
- Kapitel 3 Funktionen List
- Kapitel 4 Ligningsregning
- Kapitel 5 Tegning af grafer
- 1. Grafeksempler
- 2. Håndtering af et grafskærmbillede
- 3. Tegning af en graf
- 4. Lagring af en graf i billedhukommelsen
- 5. Tegning af to grafer i det samme skærmbillede
- 6. Manuel tegning af grafer
- 7. Brug af tabeller
- 8. Tegning af dynamiske grafer
- 9. Tegning af en graf for en rekursionsformel
- 10. Tegning af et keglesnit
- 11. Ændring af en grafs udseende
- 12. Funktionsanalyse
- Kapitel 6 Statistiske grafer og beregninger
- 1. Før udførelse af statistiske beregninger
- 2. Beregning og tegning af en graf for statistiske data med én variabel
- 3. Beregning og tegning af en graf for statistiske data med to variable
- 4. Udførelse af statistiske beregninger
- 5. Test
- 6. Konfidensinterval
- 7. Fordeling
- 8. Input- og Output-udtryk til tests, konfidensinterval, og fordeling
- 9. Statistisk formel
- Kapitel 7 Økonomiske beregninger (TVM)
- Kapitel 8 Programmering
- Kapitel 9 Regneark
- Kapitel 10 eActivity
- Kapitel 11 Hukommelsesstyring
- Kapitel 12 Systemstyring
- Kapitel 13 Datakommunikation
- Kapitel 14 Brug af SD-kort (kun fx-9860GII SD)
- Appendiks
- E-CON2 Application (English)
- 1 E-CON2 Overview
- 2 Using the Setup Wizard
- 3 Using Advanced Setup
- 4 Using a Custom Probe
- 5 Using the MULTIMETER Mode
- 6 Using Setup Memory
- 7 Using Program Converter
- 8 Starting a Sampling Operation
- 9 Using Sample Data Memory
- 10 Using the Graph Analysis Tools to Graph Data
- 11 Graph Analysis Tool Graph Screen Operations
- 12 Calling E-CON2 Functions from an eActivity
20051101
10-1
Using the Graph Analysis Tools to Graph Data
10 Using the Graph Analysis Tools to Graph Data
Graph Analysis tools make it possible to analyze graphs drawn from sampled data.
k Accessing Graph Analysis Tools
You can access Graph Analysis tools using either of the two methods described below.
uu
uu
u
Accessing Graph Analysis tools from the Graph Mode screen, which is
displayed by pressing 5(GRPH) on the E-CON2 main menu (page 1-1)
• The main menu appears after you perform a sampling operation. Press 5(GRPH) at
that time.
• When you access Graph Analysis tools using this method, you can select from among a
variety of other Analysis modes. See “Selecting an Analysis Mode and Drawing a Graph”
(page 10-2) for more information about the other Analysis modes.
uu
uu
u
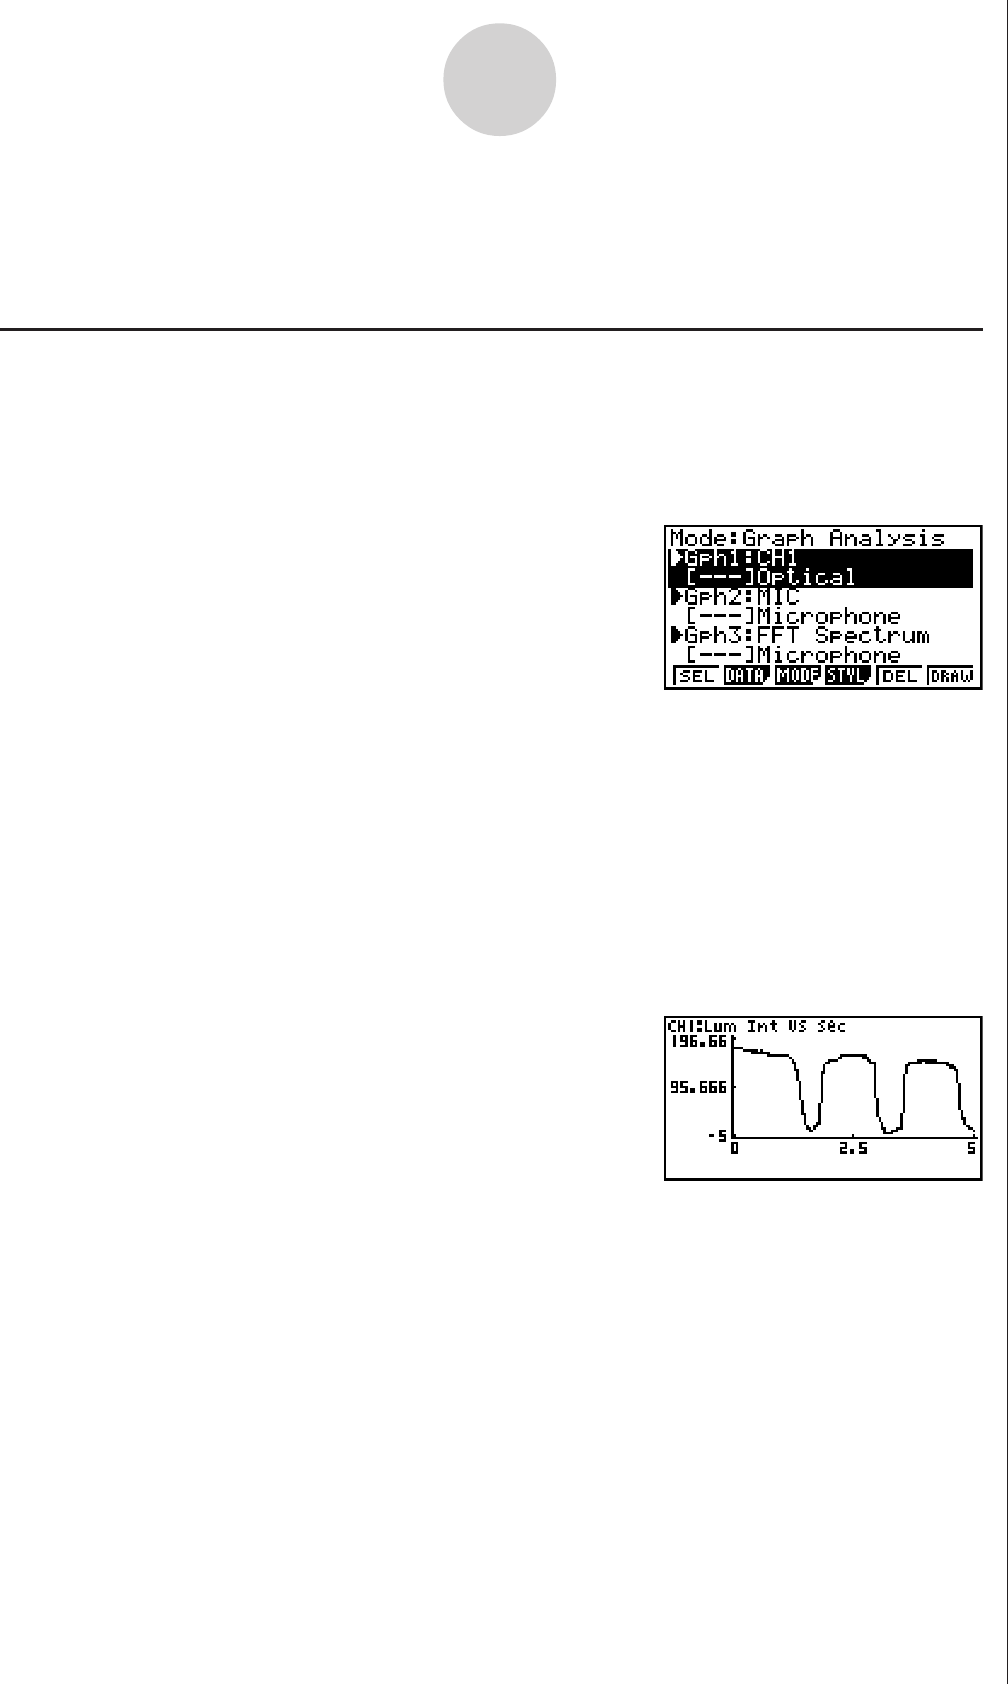
Accessing Graph Analysis tools from the screen of a graph drawn after a
sampling operation is executed from the Setup Wizard or from Advanced
Setup (Realtime Mode)
Graph Mode Screen
• In this case, data is graphed after the sampling operation is complete, and the calculator
accesses Graph Analysis tools automatically. See “Graph Screen Key Operations” on
page 11-1.
Graph Screen