
User manual - fx-9860GII_Soft


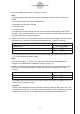
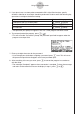


Table Of Contents
- Indhold
- Kom hurtigt i gang — Læs dette først!
- Kapitel 1 Grundlæggende funktioner
- Kapitel 2 Manuelle beregninger
- 1. Grundlæggende beregninger
- 2. Specielle funktioner
- 3. Angivelse af vinkelenhed og visningsformat
- 4. Funktionsberegninger
- 5. Numeriske beregninger
- 6. Beregninger med komplekse tal
- 7. Binære, oktale, decimale og heksadecimale beregninger med heltal
- 8. Matrixberegninger
- 9. Beregninger af metriske omregninger
- Kapitel 3 Funktionen List
- Kapitel 4 Ligningsregning
- Kapitel 5 Tegning af grafer
- 1. Grafeksempler
- 2. Håndtering af et grafskærmbillede
- 3. Tegning af en graf
- 4. Lagring af en graf i billedhukommelsen
- 5. Tegning af to grafer i det samme skærmbillede
- 6. Manuel tegning af grafer
- 7. Brug af tabeller
- 8. Tegning af dynamiske grafer
- 9. Tegning af en graf for en rekursionsformel
- 10. Tegning af et keglesnit
- 11. Ændring af en grafs udseende
- 12. Funktionsanalyse
- Kapitel 6 Statistiske grafer og beregninger
- 1. Før udførelse af statistiske beregninger
- 2. Beregning og tegning af en graf for statistiske data med én variabel
- 3. Beregning og tegning af en graf for statistiske data med to variable
- 4. Udførelse af statistiske beregninger
- 5. Test
- 6. Konfidensinterval
- 7. Fordeling
- 8. Input- og Output-udtryk til tests, konfidensinterval, og fordeling
- 9. Statistisk formel
- Kapitel 7 Økonomiske beregninger (TVM)
- Kapitel 8 Programmering
- Kapitel 9 Regneark
- Kapitel 10 eActivity
- Kapitel 11 Hukommelsesstyring
- Kapitel 12 Systemstyring
- Kapitel 13 Datakommunikation
- Kapitel 14 Brug af SD-kort (kun fx-9860GII SD)
- Appendiks
- E-CON2 Application (English)
- 1 E-CON2 Overview
- 2 Using the Setup Wizard
- 3 Using Advanced Setup
- 4 Using a Custom Probe
- 5 Using the MULTIMETER Mode
- 6 Using Setup Memory
- 7 Using Program Converter
- 8 Starting a Sampling Operation
- 9 Using Sample Data Memory
- 10 Using the Graph Analysis Tools to Graph Data
- 11 Graph Analysis Tool Graph Screen Operations
- 12 Calling E-CON2 Functions from an eActivity
20051101
2. Enter up to eight characters for the program name.
Note
Using the program converter initial default settings will create a program like the one
below.
• Associated Scientific Calculator: fx-9860 Series
• Associated Data Analyzer: EA-200
• Calibration: None
• Password: None
If you want to use these settings the way they are without changing them, skip steps 3
through 7 and go directly to step 8. If you want to change any of the settings, perform the
applicable operations in steps 3 through 7.
3. Specify the scientific calculator model to be associated with the program. Perform one of
the following key operations to associate the program with a scientific calculator.
7-2
Using Program Converter
• The number part of the scientific calculator model number you specify will appear in line
“F1:” of the program converter screen.
Note
For information about 1(CALC)4(→38K), see “Converting a CFX-9850 Series
Program to a fx-9860 Series Compatible Program” (page 7-4).
4. Specify the Data Analyzer model (EA-100 or EA-200) to be associated with the program.
Perform one of the following key operations to associate the program with a Data
Analyzer.
To associate the program with this Data Analyzer: Perform this key operation:
EA-200 2(TYPE) 1(200)
EA-100 2(TYPE) 2(100)
CFX-9850 Series
To associate the program with this calculator: Perform this key operation:
fx-9860 Series 1(CALC) 1(9860)
fx-7400 Series 1(CALC) 3(7400)
1(CALC) 2(9850)
• The number part of the Data Analyzer model number you specify will appear in line “F2:”
of the program converter screen.
Important!
• Note that the capabilities of the EA-100 and EA-200 are different. Because of this, you
should keep in mind that an EA-200 program converted to an EA-100 program and used
to perform sampling with an EA-100 setup may not produce the desired results.