
User manual - fx-9860GII_Soft


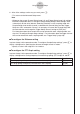


Table Of Contents
- Indhold
- Kom hurtigt i gang — Læs dette først!
- Kapitel 1 Grundlæggende funktioner
- Kapitel 2 Manuelle beregninger
- 1. Grundlæggende beregninger
- 2. Specielle funktioner
- 3. Angivelse af vinkelenhed og visningsformat
- 4. Funktionsberegninger
- 5. Numeriske beregninger
- 6. Beregninger med komplekse tal
- 7. Binære, oktale, decimale og heksadecimale beregninger med heltal
- 8. Matrixberegninger
- 9. Beregninger af metriske omregninger
- Kapitel 3 Funktionen List
- Kapitel 4 Ligningsregning
- Kapitel 5 Tegning af grafer
- 1. Grafeksempler
- 2. Håndtering af et grafskærmbillede
- 3. Tegning af en graf
- 4. Lagring af en graf i billedhukommelsen
- 5. Tegning af to grafer i det samme skærmbillede
- 6. Manuel tegning af grafer
- 7. Brug af tabeller
- 8. Tegning af dynamiske grafer
- 9. Tegning af en graf for en rekursionsformel
- 10. Tegning af et keglesnit
- 11. Ændring af en grafs udseende
- 12. Funktionsanalyse
- Kapitel 6 Statistiske grafer og beregninger
- 1. Før udførelse af statistiske beregninger
- 2. Beregning og tegning af en graf for statistiske data med én variabel
- 3. Beregning og tegning af en graf for statistiske data med to variable
- 4. Udførelse af statistiske beregninger
- 5. Test
- 6. Konfidensinterval
- 7. Fordeling
- 8. Input- og Output-udtryk til tests, konfidensinterval, og fordeling
- 9. Statistisk formel
- Kapitel 7 Økonomiske beregninger (TVM)
- Kapitel 8 Programmering
- Kapitel 9 Regneark
- Kapitel 10 eActivity
- Kapitel 11 Hukommelsesstyring
- Kapitel 12 Systemstyring
- Kapitel 13 Datakommunikation
- Kapitel 14 Brug af SD-kort (kun fx-9860GII SD)
- Appendiks
- E-CON2 Application (English)
- 1 E-CON2 Overview
- 2 Using the Setup Wizard
- 3 Using Advanced Setup
- 4 Using a Custom Probe
- 5 Using the MULTIMETER Mode
- 6 Using Setup Memory
- 7 Using Program Converter
- 8 Starting a Sampling Operation
- 9 Using Sample Data Memory
- 10 Using the Graph Analysis Tools to Graph Data
- 11 Graph Analysis Tool Graph Screen Operations
- 12 Calling E-CON2 Functions from an eActivity
20051101
3-13
Using Advanced Setup
To specify this graph source data name display setting: Press this key:
Display source data name 1(On)
Hide source data name 2(Off)
k Graph Setup
Use the Graph Setup screen to configure settings for the graph produced after sampling is
complete. You use the Sample Setup settings (page 3-5) to turn graphing on or off.
uu
uu
u
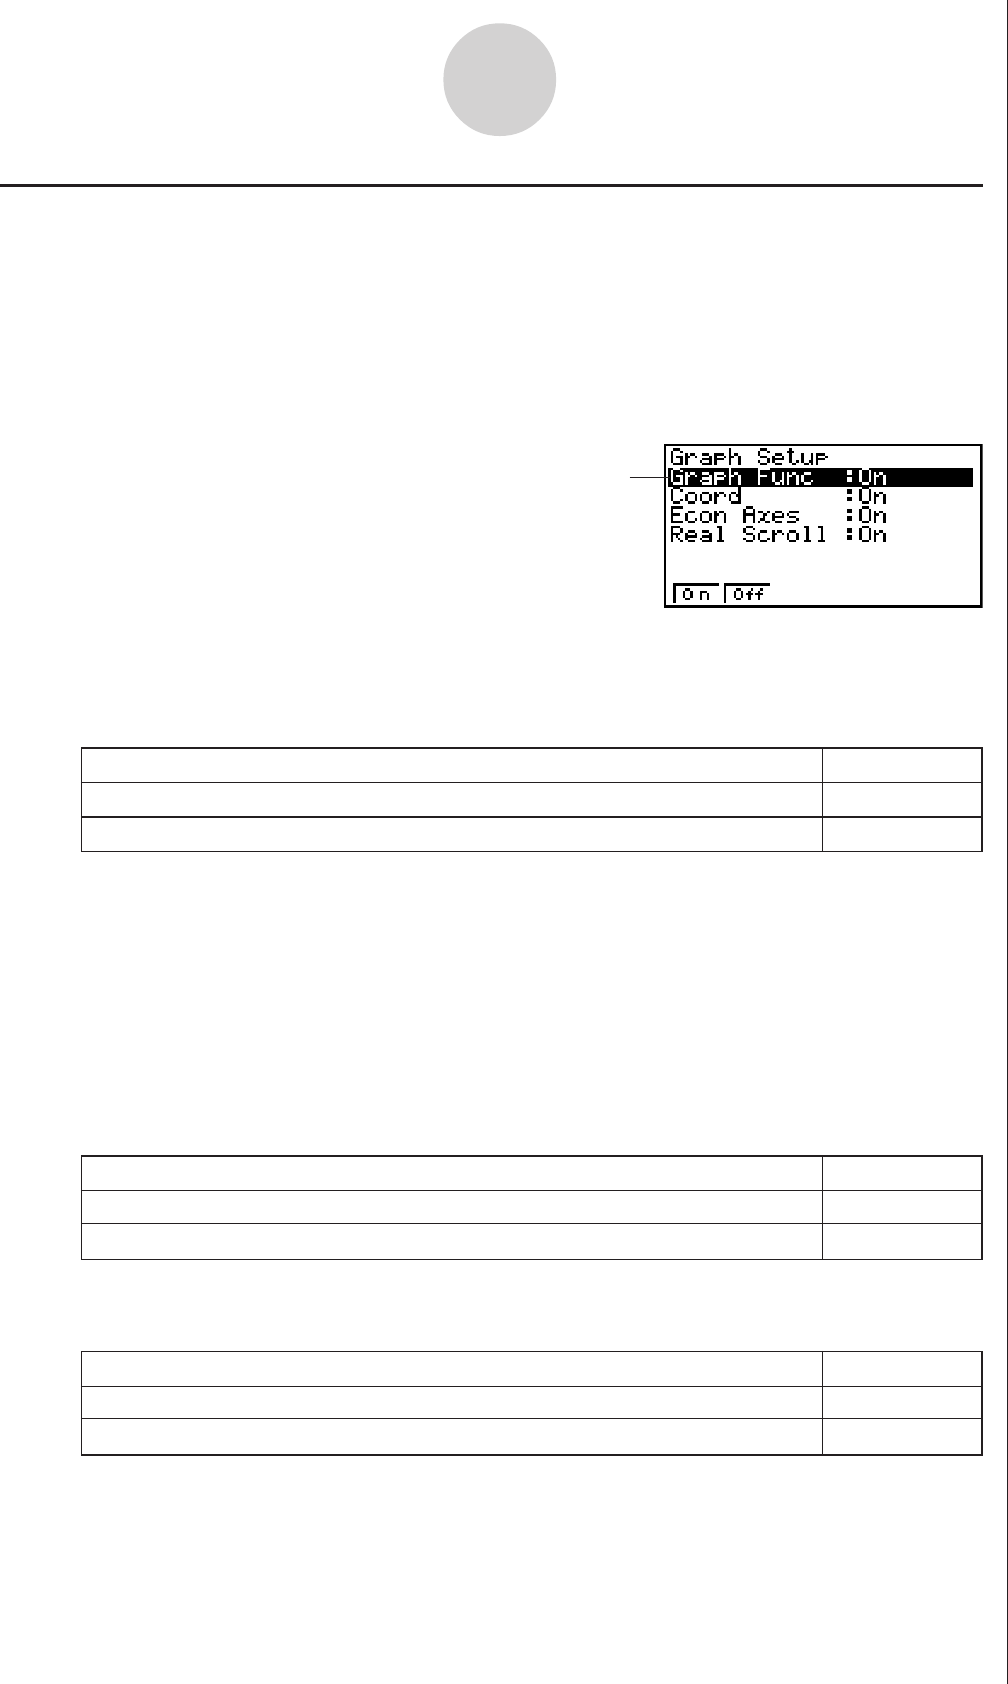
To configure Graph Setup settings
1. While the Advanced Setup menu (page 3-1) is on the display, press e(Graph).
• This displays the Graph Setup screen.
Currently selected item
Graph Setup Screen
• When the graph data is stored in a sample data memory file, the file name appears as
the source data name. When the graph data is stored in current data area, the channel
name appears.
Note
• For details about sample data memory and current data area, see “9 Using Sample Data
Memory”.
2. To change the graph source data name display setting, use the f and c cursor keys
to move the highlighting to “Graph Func”. Next, press one of the function keys described
below.
3. To change the trace operation coordinate display setting, use the f and c cursor keys
to move the highlighting to “Coord”. Next, press one of the function keys described below.
4. To change the numeric axes display setting, use the f and c cursor keys to move the
highlighting to “Econ Axes”. Next, press one of the function keys described below.
To specify this coordinate display setting for the trace operation: Press this key:
Display trace coordinates 1(On)
Hide trace coordinates 2(Off)
To specify this axes display setting: Press this key:
Display axes 1(On)
Hide axes 2(Off)
20070101