
User manual - fx-9860GII_Soft


Table Of Contents
- Indhold
- Kom hurtigt i gang — Læs dette først!
- Kapitel 1 Grundlæggende funktioner
- Kapitel 2 Manuelle beregninger
- 1. Grundlæggende beregninger
- 2. Specielle funktioner
- 3. Angivelse af vinkelenhed og visningsformat
- 4. Funktionsberegninger
- 5. Numeriske beregninger
- 6. Beregninger med komplekse tal
- 7. Binære, oktale, decimale og heksadecimale beregninger med heltal
- 8. Matrixberegninger
- 9. Beregninger af metriske omregninger
- Kapitel 3 Funktionen List
- Kapitel 4 Ligningsregning
- Kapitel 5 Tegning af grafer
- 1. Grafeksempler
- 2. Håndtering af et grafskærmbillede
- 3. Tegning af en graf
- 4. Lagring af en graf i billedhukommelsen
- 5. Tegning af to grafer i det samme skærmbillede
- 6. Manuel tegning af grafer
- 7. Brug af tabeller
- 8. Tegning af dynamiske grafer
- 9. Tegning af en graf for en rekursionsformel
- 10. Tegning af et keglesnit
- 11. Ændring af en grafs udseende
- 12. Funktionsanalyse
- Kapitel 6 Statistiske grafer og beregninger
- 1. Før udførelse af statistiske beregninger
- 2. Beregning og tegning af en graf for statistiske data med én variabel
- 3. Beregning og tegning af en graf for statistiske data med to variable
- 4. Udførelse af statistiske beregninger
- 5. Test
- 6. Konfidensinterval
- 7. Fordeling
- 8. Input- og Output-udtryk til tests, konfidensinterval, og fordeling
- 9. Statistisk formel
- Kapitel 7 Økonomiske beregninger (TVM)
- Kapitel 8 Programmering
- Kapitel 9 Regneark
- Kapitel 10 eActivity
- Kapitel 11 Hukommelsesstyring
- Kapitel 12 Systemstyring
- Kapitel 13 Datakommunikation
- Kapitel 14 Brug af SD-kort (kun fx-9860GII SD)
- Appendiks
- E-CON2 Application (English)
- 1 E-CON2 Overview
- 2 Using the Setup Wizard
- 3 Using Advanced Setup
- 4 Using a Custom Probe
- 5 Using the MULTIMETER Mode
- 6 Using Setup Memory
- 7 Using Program Converter
- 8 Starting a Sampling Operation
- 9 Using Sample Data Memory
- 10 Using the Graph Analysis Tools to Graph Data
- 11 Graph Analysis Tool Graph Screen Operations
- 12 Calling E-CON2 Functions from an eActivity
20051101
2-8
Using the Setup Wizard
k Outputting the Waveform of a Function through the Speaker
Normally, the Setup Wizard helps you configure setups for sensors connected to the EA-200.
If you select [CASIO] - [Speaker] - [y=f(x)] on the “Select Sensor” screen, however, it
configures the EA-200 to output the sound that corresponds to a function that you input and
graph on the calculator.
uu
uu
u
To configure a setup for speaker output
1. Connect the data communication cable (SB-62) to the communication port of the
calculator and the MASTER port of the EA-200.
2. Perform the first two steps of the procedure under “To configure an EA-200 setup using
Setup Wizard” on page 2-2.
3. On the “Select Sensor” screen, select [CASIO] - [Speaker] - [y=f(x)].
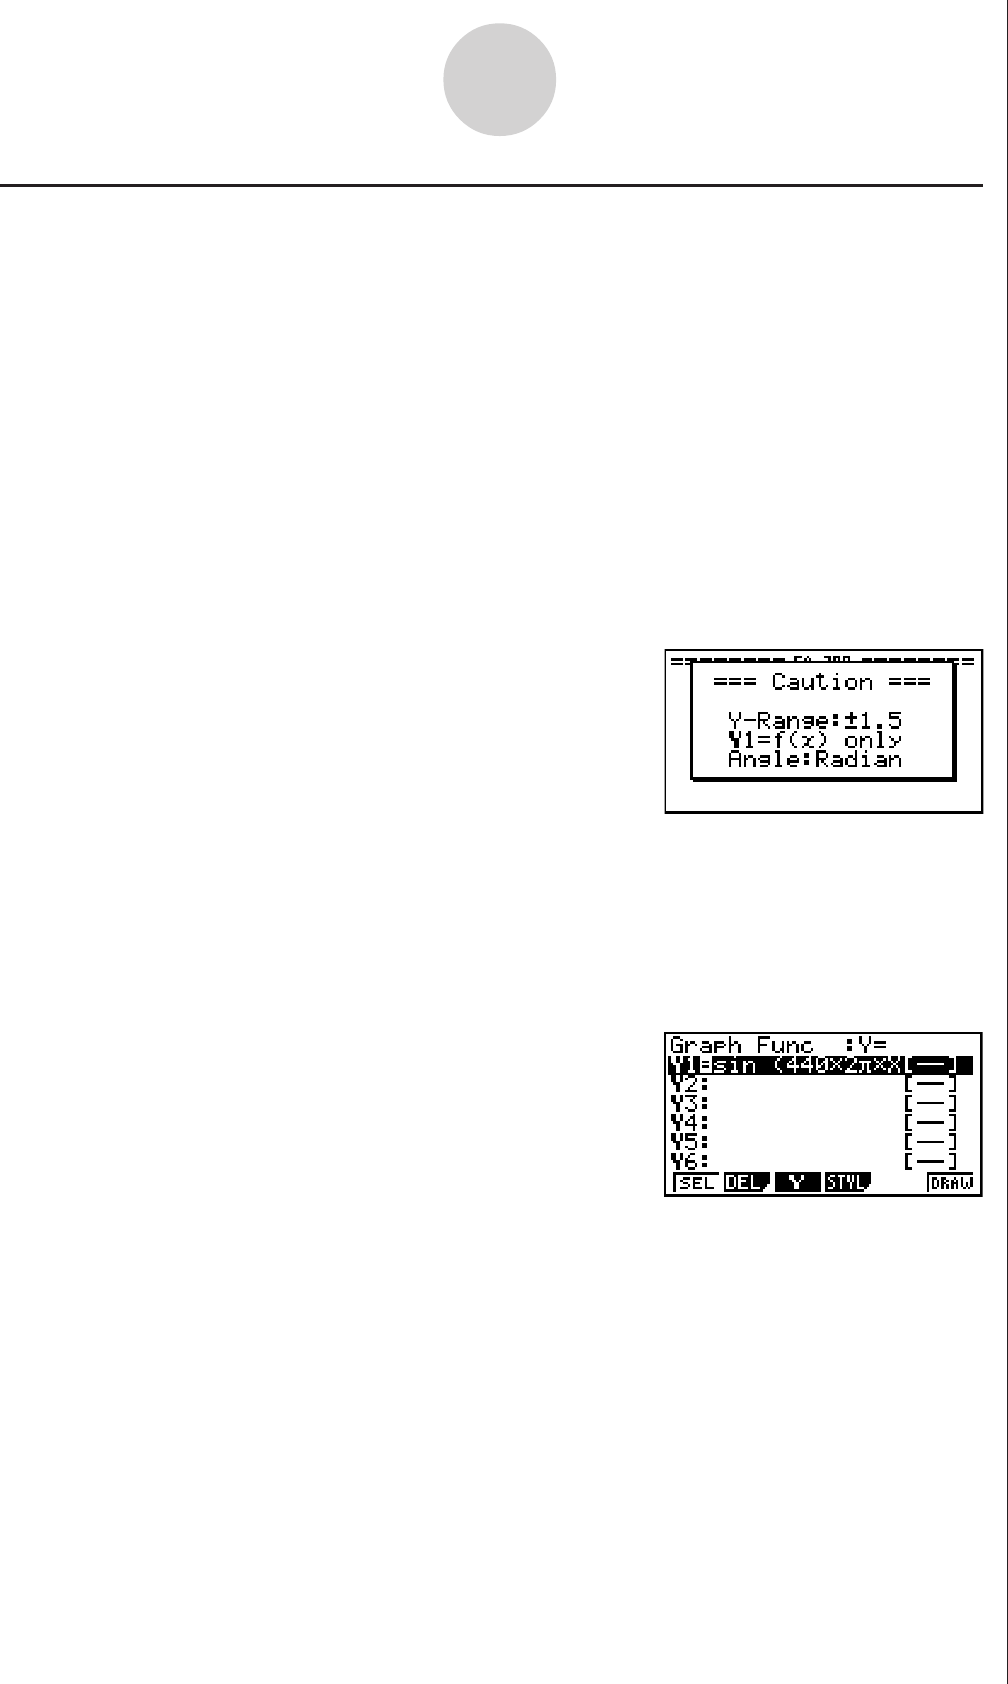
This displays a screen like the one shown below.
4. Press w to advance to the View Window setting screen.
• The following settings are configured automatically: Ymin = –1.5 and Ymax = 1.5. Do not
change these settings.
5. Press w or J to advance to the graph function list.
6. In line “Y1”, input the function of the waveform for the sound you want to input.
• Note that the angle unit is always radians.
• Input a function where the value of “Y” is within the range of –1.5 to +1.5.