
User Manual


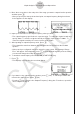
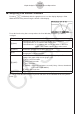


Table Of Contents
- Innehåll
- Komma igång — Läs det här först!
- Kapitel 1 Grundläggande funktioner
- Kapitel 2 Manuella beräkningar
- Kapitel 3 Listfunktionen
- Kapitel 4 Ekvationer
- Kapitel 5 Grafritning
- 1. Exempelgrafer
- 2. Kontrollera vad som visas på en grafskärm
- 3. Rita en graf
- 4. Lagra en graf i bildminnet
- 5. Rita två grafer på samma skärm
- 6. Manuella grafer
- 7. Använda tabeller
- 8. Dynamiska grafer
- 9. Grafer och rekursionsformler
- 10. Rita en graf av en konisk sektion
- 11. Ändra en grafs utseende
- 12. Funktionsanalys
- Kapitel 6 Statistikgrafer och beräkningar
- 1. Innan du använder statistiska beräkningar
- 2. Beräkna och rita statistiska data för en variabel
- 3. Beräkna och rita statistisk data för variabelpar
- 4. Utföra statistiska beräkningar
- 5. Tester
- 6. Konfidensintervall
- 7. Fördelning
- 8. Inmatnings och utmatningstermer för test, konfidensintervall och fördelning
- 9. Statistisk formel
- Kapitel 7 Finansiella beräkningar (TVM)
- Kapitel 8 Programmering
- Kapitel 9 Kalkylblad
- Kapitel 10 eActivity
- Kapitel 11 Minneshanterare
- Kapitel 12 Systemhanterare
- Kapitel 13 Datakommunikation
- Kapitel 14 PYTHON (endast fx-9860GIII, fx-9750GIII)
- Kapitel 15 Fördelning (endast fx-9860GIII, fx-9750GIII)
- Bilaga
- Examinationslägen (endast fx-9860GIII/fx-9750GIII)
- E-CON3 Application (English) (fx-9860GIII, fx-9750GIII)
- 1 E-CON3 Overview
- 2 Using the Setup Wizard
- 3 Using Advanced Setup
- 4 Using a Custom Probe
- 5 Using the MULTIMETER Mode
- 6 Using Setup Memory
- 7 Using Program Converter
- 8 Starting a Sampling Operation
- 9 Using Sample Data Memory
- 10 Using the Graph Analysis Tools to Graph Data
- 11 Graph Analysis Tool Graph Screen Operations
- 12 Calling E-CON3 Functions from an eActivity

3. Use the f and c cursor keys to cycle through the graphs until the one you want is
displayed, and then press w.
• This enters the zoom mode and causes all of the graphs to reappear, along with a
magnifying glass cursor (
) in the center of the screen.
4. Use the cursor keys to move the magnifying glass cursor to the location on the screen
that you want at the center of the enlarged or reduced screen.
5. Press w.
• This causes the magnifying glass to disappear and enters the zoom mode.
• The cursor keys perform the following operations in the zoom mode.
To do this: Press this cursor key:
Enlarge the graph image horizontally
e
Reduce the size of the graph image horizontally
d
Enlarge the graph image vertically
f
Reduce the size of the graph image vertically
c
/
6. To exit the zoom mode, press J.
11-11
Graph Analysis Tool Graph Screen Operations