
User Manual

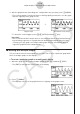

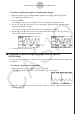
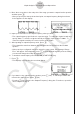


Table Of Contents
- Innehåll
- Komma igång — Läs det här först!
- Kapitel 1 Grundläggande funktioner
- Kapitel 2 Manuella beräkningar
- Kapitel 3 Listfunktionen
- Kapitel 4 Ekvationer
- Kapitel 5 Grafritning
- 1. Exempelgrafer
- 2. Kontrollera vad som visas på en grafskärm
- 3. Rita en graf
- 4. Lagra en graf i bildminnet
- 5. Rita två grafer på samma skärm
- 6. Manuella grafer
- 7. Använda tabeller
- 8. Dynamiska grafer
- 9. Grafer och rekursionsformler
- 10. Rita en graf av en konisk sektion
- 11. Ändra en grafs utseende
- 12. Funktionsanalys
- Kapitel 6 Statistikgrafer och beräkningar
- 1. Innan du använder statistiska beräkningar
- 2. Beräkna och rita statistiska data för en variabel
- 3. Beräkna och rita statistisk data för variabelpar
- 4. Utföra statistiska beräkningar
- 5. Tester
- 6. Konfidensintervall
- 7. Fördelning
- 8. Inmatnings och utmatningstermer för test, konfidensintervall och fördelning
- 9. Statistisk formel
- Kapitel 7 Finansiella beräkningar (TVM)
- Kapitel 8 Programmering
- Kapitel 9 Kalkylblad
- Kapitel 10 eActivity
- Kapitel 11 Minneshanterare
- Kapitel 12 Systemhanterare
- Kapitel 13 Datakommunikation
- Kapitel 14 PYTHON (endast fx-9860GIII, fx-9750GIII)
- Kapitel 15 Fördelning (endast fx-9860GIII, fx-9750GIII)
- Bilaga
- Examinationslägen (endast fx-9860GIII/fx-9750GIII)
- E-CON3 Application (English) (fx-9860GIII, fx-9750GIII)
- 1 E-CON3 Overview
- 2 Using the Setup Wizard
- 3 Using Advanced Setup
- 4 Using a Custom Probe
- 5 Using the MULTIMETER Mode
- 6 Using Setup Memory
- 7 Using Program Converter
- 8 Starting a Sampling Operation
- 9 Using Sample Data Memory
- 10 Using the Graph Analysis Tools to Graph Data
- 11 Graph Analysis Tool Graph Screen Operations
- 12 Calling E-CON3 Functions from an eActivity

k Performing Regression
You can use the procedure below to perform regression for a range specified using the trace
pointer. All of the following regression types are supported: Linear, Med-Med, Quadratic,
Cubic, Quartic, Logarithmic, Exponential, Power, Sine, and Logistic.
For details about these regression types, see pages 6-12 through 6-14 under Chapter 6 of
this manual.
The following procedure shows how to perform quadratic regression. The same general
steps can also be used to perform the other types of regression.
u
To perform quadratic regression
1. On the graph screen, press K, and then 4(CALC).
• The [CALC] menu appears at the bottom of the display.
2. Press 5(X^2).
• This displays the trace pointer for selecting the range on the graph.
3. Move the trace pointer to the start point of the range for which you want to perform
quadratic regression, and then press w.
4. Move the trace pointer to the end point of the range for which you want to perform
quadratic regression, and then press w.
• This displays the quadratic regression calculation result screen.
11-8
Graph Analysis Tool Graph Screen Operations