
User Manual
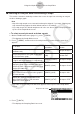
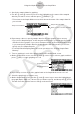

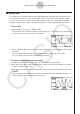
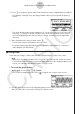
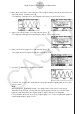
Table Of Contents
- Innehåll
- Komma igång — Läs det här först!
- Kapitel 1 Grundläggande funktioner
- Kapitel 2 Manuella beräkningar
- Kapitel 3 Listfunktionen
- Kapitel 4 Ekvationer
- Kapitel 5 Grafritning
- 1. Exempelgrafer
- 2. Kontrollera vad som visas på en grafskärm
- 3. Rita en graf
- 4. Lagra en graf i bildminnet
- 5. Rita två grafer på samma skärm
- 6. Manuella grafer
- 7. Använda tabeller
- 8. Dynamiska grafer
- 9. Grafer och rekursionsformler
- 10. Rita en graf av en konisk sektion
- 11. Ändra en grafs utseende
- 12. Funktionsanalys
- Kapitel 6 Statistikgrafer och beräkningar
- 1. Innan du använder statistiska beräkningar
- 2. Beräkna och rita statistiska data för en variabel
- 3. Beräkna och rita statistisk data för variabelpar
- 4. Utföra statistiska beräkningar
- 5. Tester
- 6. Konfidensintervall
- 7. Fördelning
- 8. Inmatnings och utmatningstermer för test, konfidensintervall och fördelning
- 9. Statistisk formel
- Kapitel 7 Finansiella beräkningar (TVM)
- Kapitel 8 Programmering
- Kapitel 9 Kalkylblad
- Kapitel 10 eActivity
- Kapitel 11 Minneshanterare
- Kapitel 12 Systemhanterare
- Kapitel 13 Datakommunikation
- Kapitel 14 PYTHON (endast fx-9860GIII, fx-9750GIII)
- Kapitel 15 Fördelning (endast fx-9860GIII, fx-9750GIII)
- Bilaga
- Examinationslägen (endast fx-9860GIII/fx-9750GIII)
- E-CON3 Application (English) (fx-9860GIII, fx-9750GIII)
- 1 E-CON3 Overview
- 2 Using the Setup Wizard
- 3 Using Advanced Setup
- 4 Using a Custom Probe
- 5 Using the MULTIMETER Mode
- 6 Using Setup Memory
- 7 Using Program Converter
- 8 Starting a Sampling Operation
- 9 Using Sample Data Memory
- 10 Using the Graph Analysis Tools to Graph Data
- 11 Graph Analysis Tool Graph Screen Operations
- 12 Calling E-CON3 Functions from an eActivity

k Using Trace
Trace displays a crosshair pointer on the displayed graph along with the coordinates of the
current cursor position. You can use the cursor keys to move the pointer along the graph.
You can also use trace to obtain the periodic frequency value for a particular range, and
assign the range (time) and periodic frequency values in separate Alpha-Memory values.
u
To use trace
1. On the graph screen, press !1(TRCE).
• This causes a trace pointer to appear on the graph. The coordinates of the current trace
pointer location are also shown on the display.
2. Use the d and e cursor keys to move the trace pointer along the graph to the location
you want.
• The coordinate values change in accordance with the trace pointer movement.
• You can exit the trace pointer at any time by pressing J.
u
To obtain the periodic frequency value
1. Use the procedure under “To use trace” above to start a trace operation.
2. Move the trace pointer to the start point of the range whose periodic frequency you want
to obtain, and then press w.
3. Move the trace pointer to the end point of the range whose periodic frequency you want
to obtain.
• This causes the period and periodic frequency value at the start point you selected in
step 2 to appear along the bottom of the screen.
11-3
Graph Analysis Tool Graph Screen Operations