
User Manual
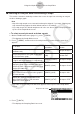
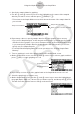

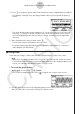
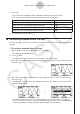
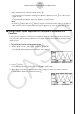
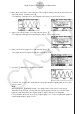
Table Of Contents
- Innehåll
- Komma igång — Läs det här först!
- Kapitel 1 Grundläggande funktioner
- Kapitel 2 Manuella beräkningar
- Kapitel 3 Listfunktionen
- Kapitel 4 Ekvationer
- Kapitel 5 Grafritning
- 1. Exempelgrafer
- 2. Kontrollera vad som visas på en grafskärm
- 3. Rita en graf
- 4. Lagra en graf i bildminnet
- 5. Rita två grafer på samma skärm
- 6. Manuella grafer
- 7. Använda tabeller
- 8. Dynamiska grafer
- 9. Grafer och rekursionsformler
- 10. Rita en graf av en konisk sektion
- 11. Ändra en grafs utseende
- 12. Funktionsanalys
- Kapitel 6 Statistikgrafer och beräkningar
- 1. Innan du använder statistiska beräkningar
- 2. Beräkna och rita statistiska data för en variabel
- 3. Beräkna och rita statistisk data för variabelpar
- 4. Utföra statistiska beräkningar
- 5. Tester
- 6. Konfidensintervall
- 7. Fördelning
- 8. Inmatnings och utmatningstermer för test, konfidensintervall och fördelning
- 9. Statistisk formel
- Kapitel 7 Finansiella beräkningar (TVM)
- Kapitel 8 Programmering
- Kapitel 9 Kalkylblad
- Kapitel 10 eActivity
- Kapitel 11 Minneshanterare
- Kapitel 12 Systemhanterare
- Kapitel 13 Datakommunikation
- Kapitel 14 PYTHON (endast fx-9860GIII, fx-9750GIII)
- Kapitel 15 Fördelning (endast fx-9860GIII, fx-9750GIII)
- Bilaga
- Examinationslägen (endast fx-9860GIII/fx-9750GIII)
- E-CON3 Application (English) (fx-9860GIII, fx-9750GIII)
- 1 E-CON3 Overview
- 2 Using the Setup Wizard
- 3 Using Advanced Setup
- 4 Using a Custom Probe
- 5 Using the MULTIMETER Mode
- 6 Using Setup Memory
- 7 Using Program Converter
- 8 Starting a Sampling Operation
- 9 Using Sample Data Memory
- 10 Using the Graph Analysis Tools to Graph Data
- 11 Graph Analysis Tool Graph Screen Operations
- 12 Calling E-CON3 Functions from an eActivity

11 Graph Analysis Tool Graph Screen
Operations
This section explains the various operations you can perform on the graph screen after
drawing a graph.
You can perform these operations on a graph screen produced by a sampling operation, or by
the operation described under “Selecting an Analysis Mode and Drawing a Graph” on page
10-2.
k Graph Screen Key Operations
On the graph screen, you can use the keys described in the table below to analyze (CALC)
graphs by reading data points along the graph (Trace) and enlarging specific parts of the
graph (Zoom).
Key Operation Description
!1
(TRCE)
Displays a trace pointer on the graph along with the coordinates of the
current cursor location. Trace can also be used to obtain the periodic
frequency of a specific range on the graph and assign it to a variable.
See “Using Trace” on page 11-3.
!2
(ZOOM)
Starts a zoom operation, which you can use to enlarge or reduce the
size of the graph along the x-axis or the y-axis. See “Using Zoom” on
page 11-4.
!3(V-WIN)
Displays a function menu of special View Window commands for the
E-CON3 Mode graph screen.
For details about each command, see “Configuring View Window
Parameters” on page 11-14.
!4(SKTCH)
Displays a menu that contains the following commands: Cls, Plot,
F-Line, Text, PEN, Vert, and Hztl. For details about each command,
see “5-10 Changing the Appearance of a Graph” under Chapter 5 of
this manual.
K1
(
PICT
)
Saves the currently displayed graph as a graphic image. You can recall
a saved graph image and overlay it on another graph to compare them.
For details about these procedures, see “5-4 Storing a Graph in Picture
Memory” under Chapter 5 of this manual.
K2
(
LMEM
)
Displays a menu of functions for saving the sample values in a specific
range of a graph to a list. See “Transforming Sampled Data to List
Data” on page 11-5.
K3(EDIT)
Displays a menu of functions for zooming and editing a particular graph
when the graph screen contains multiple graphs. See “Working with
Multiple Graphs” on page 11-10.
11-1
Graph Analysis Tool Graph Screen Operations