
User Manual
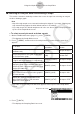
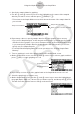
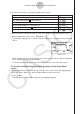

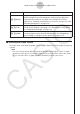
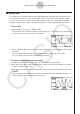
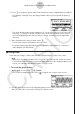
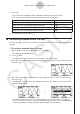
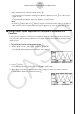
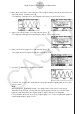
Table Of Contents
- Innehåll
- Komma igång — Läs det här först!
- Kapitel 1 Grundläggande funktioner
- Kapitel 2 Manuella beräkningar
- Kapitel 3 Listfunktionen
- Kapitel 4 Ekvationer
- Kapitel 5 Grafritning
- 1. Exempelgrafer
- 2. Kontrollera vad som visas på en grafskärm
- 3. Rita en graf
- 4. Lagra en graf i bildminnet
- 5. Rita två grafer på samma skärm
- 6. Manuella grafer
- 7. Använda tabeller
- 8. Dynamiska grafer
- 9. Grafer och rekursionsformler
- 10. Rita en graf av en konisk sektion
- 11. Ändra en grafs utseende
- 12. Funktionsanalys
- Kapitel 6 Statistikgrafer och beräkningar
- 1. Innan du använder statistiska beräkningar
- 2. Beräkna och rita statistiska data för en variabel
- 3. Beräkna och rita statistisk data för variabelpar
- 4. Utföra statistiska beräkningar
- 5. Tester
- 6. Konfidensintervall
- 7. Fördelning
- 8. Inmatnings och utmatningstermer för test, konfidensintervall och fördelning
- 9. Statistisk formel
- Kapitel 7 Finansiella beräkningar (TVM)
- Kapitel 8 Programmering
- Kapitel 9 Kalkylblad
- Kapitel 10 eActivity
- Kapitel 11 Minneshanterare
- Kapitel 12 Systemhanterare
- Kapitel 13 Datakommunikation
- Kapitel 14 PYTHON (endast fx-9860GIII, fx-9750GIII)
- Kapitel 15 Fördelning (endast fx-9860GIII, fx-9750GIII)
- Bilaga
- Examinationslägen (endast fx-9860GIII/fx-9750GIII)
- E-CON3 Application (English) (fx-9860GIII, fx-9750GIII)
- 1 E-CON3 Overview
- 2 Using the Setup Wizard
- 3 Using Advanced Setup
- 4 Using a Custom Probe
- 5 Using the MULTIMETER Mode
- 6 Using Setup Memory
- 7 Using Program Converter
- 8 Starting a Sampling Operation
- 9 Using Sample Data Memory
- 10 Using the Graph Analysis Tools to Graph Data
- 11 Graph Analysis Tool Graph Screen Operations
- 12 Calling E-CON3 Functions from an eActivity

4. Specify the sampled data for graphing.
a. Use the f and c cursor keys to move the highlighting to the name of the sampled
data file you want to select, and then press 1(ASGN) or w.
• This returns to the Graph Mode screen, which shows the name of the sample data file
you selected.
Graph Mode Screen
Graph on/off indicator
Sample data file name
Name of sensor used for sampling
b. Repeat step a above to specify sample data files for other graphs, if there are any.
• If you select “Graph Analysis” as the analysis mode in step 2, you must specify sample
data files for three graphs. If you select “Compare Graph” as the analysis mode in step
2, you must specify sample data files for two graphs. With other modes, you need to
specify only one sample data file.
• For details about Sampling Data List screen operations, see “9 Using Sample Data
Memory”.
5. Turn on graphing for each of the graphs listed on the Graph Mode screen.
a. On the Graph Mode screen, use the f and c cursor keys to select a graph, and then
press 1(SEL) to toggle graphing on or off.
Graphing turned off.
Graphing turned on.
b. Repeat step a to turn each of the graphs listed on the Graph Mode screen on or off.
6. Select the graph style you want to use.
a. On the Graph Mode screen, use the f and c cursor keys to move the highlighting to
the graph (Gph1, Gph2, etc.) whose style you want to specify, and then press 4(STYL).
This will cause the function menu to change as shown below.
10-3
Using the Graph Analysis Tools to Graph Data