
User Manual
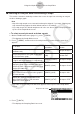
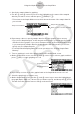

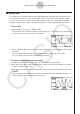
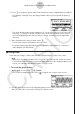
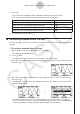
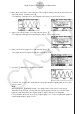
Table Of Contents
- Innehåll
- Komma igång — Läs det här först!
- Kapitel 1 Grundläggande funktioner
- Kapitel 2 Manuella beräkningar
- Kapitel 3 Listfunktionen
- Kapitel 4 Ekvationer
- Kapitel 5 Grafritning
- 1. Exempelgrafer
- 2. Kontrollera vad som visas på en grafskärm
- 3. Rita en graf
- 4. Lagra en graf i bildminnet
- 5. Rita två grafer på samma skärm
- 6. Manuella grafer
- 7. Använda tabeller
- 8. Dynamiska grafer
- 9. Grafer och rekursionsformler
- 10. Rita en graf av en konisk sektion
- 11. Ändra en grafs utseende
- 12. Funktionsanalys
- Kapitel 6 Statistikgrafer och beräkningar
- 1. Innan du använder statistiska beräkningar
- 2. Beräkna och rita statistiska data för en variabel
- 3. Beräkna och rita statistisk data för variabelpar
- 4. Utföra statistiska beräkningar
- 5. Tester
- 6. Konfidensintervall
- 7. Fördelning
- 8. Inmatnings och utmatningstermer för test, konfidensintervall och fördelning
- 9. Statistisk formel
- Kapitel 7 Finansiella beräkningar (TVM)
- Kapitel 8 Programmering
- Kapitel 9 Kalkylblad
- Kapitel 10 eActivity
- Kapitel 11 Minneshanterare
- Kapitel 12 Systemhanterare
- Kapitel 13 Datakommunikation
- Kapitel 14 PYTHON (endast fx-9860GIII, fx-9750GIII)
- Kapitel 15 Fördelning (endast fx-9860GIII, fx-9750GIII)
- Bilaga
- Examinationslägen (endast fx-9860GIII/fx-9750GIII)
- E-CON3 Application (English) (fx-9860GIII, fx-9750GIII)
- 1 E-CON3 Overview
- 2 Using the Setup Wizard
- 3 Using Advanced Setup
- 4 Using a Custom Probe
- 5 Using the MULTIMETER Mode
- 6 Using Setup Memory
- 7 Using Program Converter
- 8 Starting a Sampling Operation
- 9 Using Sample Data Memory
- 10 Using the Graph Analysis Tools to Graph Data
- 11 Graph Analysis Tool Graph Screen Operations
- 12 Calling E-CON3 Functions from an eActivity

k Selecting an Analysis Mode and Drawing a Graph
This section contains a detailed procedure that covers all steps from selecting an analysis
mode to drawing a graph.
Note
• Step 4 through step 6 are not essential and may be skipped, if you want. Skipping any
step automatically applies the initial default values for its settings.
• If you skip step 2, the default analysis mode is the one whose name is displayed in the
top line of the Graph Mode screen.
u
To select an analysis mode and draw a graph
1. On the E-CON3 main menu (page 1-1), press 5(GRPH).
• This displays the Graph Mode screen.
2. Press 3(MODE), and then select the analysis mode you want from the menu that
appears.
To do this:
Perform this menu
operation:
To select this
mode:
Graph three sets of sampled data
simultaneously
[Norm] Graph Analysis
Graph sampled data along with its first and
second derivative graph
[diff] d/dt & d
2
/dt
2
Display the graphs of different sampled data
in upper and lower windows for comparison
[CMPR]/[GRPH]
Compare Graph
Output sampled data from the speaker,
displaying graph of the raw data in the upper
window and the output waveform in the lower
window (EA-200 only)
[CMPR]/[Snd]
Compare Sound
Display the graph of sampled data in the
upper window and its first derivative graph in
the lower window
[CMPR]/[d/dt]
Compare d/dt
Display the graph of sampled data in the
upper window and its second derivative
graph in the lower window
[CMPR]/[d
2
/dt
2
]
Compare d
2
/dt
2
• The name of the currently selected mode appears in the top line of the Graph Mode
screen.
Analysis mode name
3. Press 2(DATA).
• This displays the Sampling Data List screen.
10-2
Using the Graph Analysis Tools to Graph Data