
User Manual


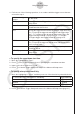

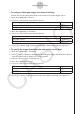
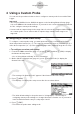
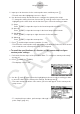
Table Of Contents
- Innehåll
- Komma igång — Läs det här först!
- Kapitel 1 Grundläggande funktioner
- Kapitel 2 Manuella beräkningar
- Kapitel 3 Listfunktionen
- Kapitel 4 Ekvationer
- Kapitel 5 Grafritning
- 1. Exempelgrafer
- 2. Kontrollera vad som visas på en grafskärm
- 3. Rita en graf
- 4. Lagra en graf i bildminnet
- 5. Rita två grafer på samma skärm
- 6. Manuella grafer
- 7. Använda tabeller
- 8. Dynamiska grafer
- 9. Grafer och rekursionsformler
- 10. Rita en graf av en konisk sektion
- 11. Ändra en grafs utseende
- 12. Funktionsanalys
- Kapitel 6 Statistikgrafer och beräkningar
- 1. Innan du använder statistiska beräkningar
- 2. Beräkna och rita statistiska data för en variabel
- 3. Beräkna och rita statistisk data för variabelpar
- 4. Utföra statistiska beräkningar
- 5. Tester
- 6. Konfidensintervall
- 7. Fördelning
- 8. Inmatnings och utmatningstermer för test, konfidensintervall och fördelning
- 9. Statistisk formel
- Kapitel 7 Finansiella beräkningar (TVM)
- Kapitel 8 Programmering
- Kapitel 9 Kalkylblad
- Kapitel 10 eActivity
- Kapitel 11 Minneshanterare
- Kapitel 12 Systemhanterare
- Kapitel 13 Datakommunikation
- Kapitel 14 PYTHON (endast fx-9860GIII, fx-9750GIII)
- Kapitel 15 Fördelning (endast fx-9860GIII, fx-9750GIII)
- Bilaga
- Examinationslägen (endast fx-9860GIII/fx-9750GIII)
- E-CON3 Application (English) (fx-9860GIII, fx-9750GIII)
- 1 E-CON3 Overview
- 2 Using the Setup Wizard
- 3 Using Advanced Setup
- 4 Using a Custom Probe
- 5 Using the MULTIMETER Mode
- 6 Using Setup Memory
- 7 Using Program Converter
- 8 Starting a Sampling Operation
- 9 Using Sample Data Memory
- 10 Using the Graph Analysis Tools to Graph Data
- 11 Graph Analysis Tool Graph Screen Operations
- 12 Calling E-CON3 Functions from an eActivity

k Graph Setup
Use the Graph Setup screen to configure settings for the graph produced after sampling is
complete. You use the Sample Setup settings (page 3-5) to turn graphing on or off.
u
To configure Graph Setup settings
1. While the Advanced Setup menu (page 3-1) is on the display, press e(Graph).
• This displays the Graph Setup screen.
Currently selected item
Graph Setup Screen
2. To change the graph source data name display setting, use the f and c cursor keys
to move the highlighting to “Graph Func”. Next, press one of the function keys described
below.
To specify this graph source data name display setting: Press this key:
Display source data name
1(On)
Hide source data name
2(Off)
• When the graph data is stored in a sample data memory file, the file name appears as
the source data name. When the graph data is stored in current data area, the channel
name appears.
Note
• For details about sample data memory and current data area, see “9 Using Sample Data
Memory”.
3. To change the trace operation coordinate display setting, use the f and c cursor keys
to move the highlighting to “Coord”. Next, press one of the function keys described below.
To specify this coordinate display setting for the trace operation: Press this key:
Display trace coordinates
1(On)
Hide trace coordinates
2(Off)
4. To change the numeric axes display setting, use the f and c cursor keys to move the
highlighting to “Econ Axes”. Next, press one of the function keys described below.
To specify this axes display setting: Press this key:
Display axes
1(On)
Hide axes
2(Off)
3-13
Using Advanced Setup