
User Manual

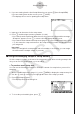


Table Of Contents
- Contents
- Getting Acquainted — Read This First!
- Chapter 1 Basic Operation
- Chapter 2 Manual Calculations
- 1. Basic Calculations
- 2. Special Functions
- 3. Specifying the Angle Unit and Display Format
- 4. Function Calculations
- 5. Numerical Calculations
- 6. Complex Number Calculations
- 7. Binary, Octal, Decimal, and Hexadecimal Calculations with Integers
- 8. Matrix Calculations
- 9. Vector Calculations
- 10. Metric Conversion Calculations
- Chapter 3 List Function
- Chapter 4 Equation Calculations
- Chapter 5 Graphing
- 1. Sample Graphs
- 2. Controlling What Appears on a Graph Screen
- 3. Drawing a Graph
- 4. Storing a Graph in Picture Memory
- 5. Drawing Two Graphs on the Same Screen
- 6. Manual Graphing
- 7. Using Tables
- 8. Dynamic Graphing
- 9. Graphing a Recursion Formula
- 10. Graphing a Conic Section
- 11. Changing the Appearance of a Graph
- 12. Function Analysis
- Chapter 6 Statistical Graphs and Calculations
- 1. Before Performing Statistical Calculations
- 2. Calculating and Graphing Single-Variable Statistical Data
- 3. Calculating and Graphing Paired-Variable Statistical Data
- 4. Performing Statistical Calculations
- 5. Tests
- 6. Confidence Interval
- 7. Distribution
- 8. Input and Output Terms of Tests, Confidence Interval, and Distribution
- 9. Statistic Formula
- Chapter 7 Financial Calculation (TVM)
- Chapter 8 Programming
- Chapter 9 Spreadsheet
- Chapter 10 eActivity
- Chapter 11 Memory Manager
- Chapter 12 System Manager
- Chapter 13 Data Communication
- Chapter 14 PYTHON (fx-9860GIII, fx-9750GIII only)
- Chapter 15 Distribution (fx-9860GIII, fx-9750GIII only)
- Appendix
- Examination Modes (fx-9860GIII, fx-9750GIII only)
- E-CON3 Application (English) (fx-9860GIII, fx-9750GIII)
- 1 E-CON3 Overview
- 2 Using the Setup Wizard
- 3 Using Advanced Setup
- 4 Using a Custom Probe
- 5 Using the MULTIMETER Mode
- 6 Using Setup Memory
- 7 Using Program Converter
- 8 Starting a Sampling Operation
- 9 Using Sample Data Memory
- 10 Using the Graph Analysis Tools to Graph Data
- 11 Graph Analysis Tool Graph Screen Operations
- 12 Calling E-CON3 Functions from an eActivity

k Zero Adjusting a Custom Probe
This procedure zero adjusts a custom probe and sets its intercept value based on an actual
sample using the applicable custom probe.
u
To zero adjust a custom probe
1. Connect the calculator and Data Logger, and connect the custom probe you want to zero
adjust to CH1 of the Data Logger.
2. What you should do first depends on whether you are configuring a new custom probe for
zero adjusting, or editing the configuration of an existing custom probe.
If you are configuring a new custom probe:
• Perform steps 1 through 6 of the procedure under “To configure a custom probe setup”
on page 4-1.
• Auto calibrate will automatically set the intercept, so you do not need to specify it in step
6 of the above procedure.
If you are editing the configuration of an existing custom probe:
• Perform steps 1 through 3 of the procedure under “To edit a custom probe setup” on
page 4-6.
3. Press 3(ZERO).
• This will start the sampling operation with the sensor connected to Data Logger’s CH1,
and then display a screen like the one shown below.
4. At the point your want to perform zero adjustment (the point that the displayed value is
the appropriate zero adjust value), press w.
• This will return to the custom probe setup screen.
• The E-CON3 will set the intercept value automatically based on the sampled value. The
automatically configured value will appear on the custom probe setup screen, where you
can view it.
5. Press w, and then input a memory number from 1 to 99.
• This saves the custom probe setup and returns to the custom probe list.
4-5
Using a Custom Probe