
User Manual
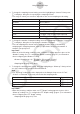
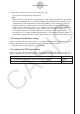


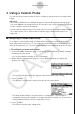
Table Of Contents
- Contents
- Getting Acquainted — Read This First!
- Chapter 1 Basic Operation
- Chapter 2 Manual Calculations
- 1. Basic Calculations
- 2. Special Functions
- 3. Specifying the Angle Unit and Display Format
- 4. Function Calculations
- 5. Numerical Calculations
- 6. Complex Number Calculations
- 7. Binary, Octal, Decimal, and Hexadecimal Calculations with Integers
- 8. Matrix Calculations
- 9. Vector Calculations
- 10. Metric Conversion Calculations
- Chapter 3 List Function
- Chapter 4 Equation Calculations
- Chapter 5 Graphing
- 1. Sample Graphs
- 2. Controlling What Appears on a Graph Screen
- 3. Drawing a Graph
- 4. Storing a Graph in Picture Memory
- 5. Drawing Two Graphs on the Same Screen
- 6. Manual Graphing
- 7. Using Tables
- 8. Dynamic Graphing
- 9. Graphing a Recursion Formula
- 10. Graphing a Conic Section
- 11. Changing the Appearance of a Graph
- 12. Function Analysis
- Chapter 6 Statistical Graphs and Calculations
- 1. Before Performing Statistical Calculations
- 2. Calculating and Graphing Single-Variable Statistical Data
- 3. Calculating and Graphing Paired-Variable Statistical Data
- 4. Performing Statistical Calculations
- 5. Tests
- 6. Confidence Interval
- 7. Distribution
- 8. Input and Output Terms of Tests, Confidence Interval, and Distribution
- 9. Statistic Formula
- Chapter 7 Financial Calculation (TVM)
- Chapter 8 Programming
- Chapter 9 Spreadsheet
- Chapter 10 eActivity
- Chapter 11 Memory Manager
- Chapter 12 System Manager
- Chapter 13 Data Communication
- Chapter 14 PYTHON (fx-9860GIII, fx-9750GIII only)
- Chapter 15 Distribution (fx-9860GIII, fx-9750GIII only)
- Appendix
- Examination Modes (fx-9860GIII, fx-9750GIII only)
- E-CON3 Application (English) (fx-9860GIII, fx-9750GIII)
- 1 E-CON3 Overview
- 2 Using the Setup Wizard
- 3 Using Advanced Setup
- 4 Using a Custom Probe
- 5 Using the MULTIMETER Mode
- 6 Using Setup Memory
- 7 Using Program Converter
- 8 Starting a Sampling Operation
- 9 Using Sample Data Memory
- 10 Using the Graph Analysis Tools to Graph Data
- 11 Graph Analysis Tool Graph Screen Operations
- 12 Calling E-CON3 Functions from an eActivity

k Graph Setup
Use the Graph Setup screen to configure settings for the graph produced after sampling is
complete. You use the Sample Setup settings (page 3-5) to turn graphing on or off.
u
To configure Graph Setup settings
1. While the Advanced Setup menu (page 3-1) is on the display, press e(Graph).
• This displays the Graph Setup screen.
Currently selected item
Graph Setup Screen
2. To change the graph source data name display setting, use the f and c cursor keys
to move the highlighting to “Graph Func”. Next, press one of the function keys described
below.
To specify this graph source data name display setting: Press this key:
Display source data name
1(On)
Hide source data name
2(Off)
• When the graph data is stored in a sample data memory file, the file name appears as
the source data name. When the graph data is stored in current data area, the channel
name appears.
Note
• For details about sample data memory and current data area, see “9 Using Sample Data
Memory”.
3. To change the trace operation coordinate display setting, use the f and c cursor keys
to move the highlighting to “Coord”. Next, press one of the function keys described below.
To specify this coordinate display setting for the trace operation: Press this key:
Display trace coordinates
1(On)
Hide trace coordinates
2(Off)
4. To change the numeric axes display setting, use the f and c cursor keys to move the
highlighting to “Econ Axes”. Next, press one of the function keys described below.
To specify this axes display setting: Press this key:
Display axes
1(On)
Hide axes
2(Off)
3-13
Using Advanced Setup