
User Manual


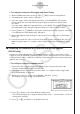
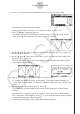
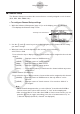
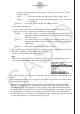
Table Of Contents
- Contents
- Getting Acquainted — Read This First!
- Chapter 1 Basic Operation
- Chapter 2 Manual Calculations
- 1. Basic Calculations
- 2. Special Functions
- 3. Specifying the Angle Unit and Display Format
- 4. Function Calculations
- 5. Numerical Calculations
- 6. Complex Number Calculations
- 7. Binary, Octal, Decimal, and Hexadecimal Calculations with Integers
- 8. Matrix Calculations
- 9. Vector Calculations
- 10. Metric Conversion Calculations
- Chapter 3 List Function
- Chapter 4 Equation Calculations
- Chapter 5 Graphing
- 1. Sample Graphs
- 2. Controlling What Appears on a Graph Screen
- 3. Drawing a Graph
- 4. Storing a Graph in Picture Memory
- 5. Drawing Two Graphs on the Same Screen
- 6. Manual Graphing
- 7. Using Tables
- 8. Dynamic Graphing
- 9. Graphing a Recursion Formula
- 10. Graphing a Conic Section
- 11. Changing the Appearance of a Graph
- 12. Function Analysis
- Chapter 6 Statistical Graphs and Calculations
- 1. Before Performing Statistical Calculations
- 2. Calculating and Graphing Single-Variable Statistical Data
- 3. Calculating and Graphing Paired-Variable Statistical Data
- 4. Performing Statistical Calculations
- 5. Tests
- 6. Confidence Interval
- 7. Distribution
- 8. Input and Output Terms of Tests, Confidence Interval, and Distribution
- 9. Statistic Formula
- Chapter 7 Financial Calculation (TVM)
- Chapter 8 Programming
- Chapter 9 Spreadsheet
- Chapter 10 eActivity
- Chapter 11 Memory Manager
- Chapter 12 System Manager
- Chapter 13 Data Communication
- Chapter 14 PYTHON (fx-9860GIII, fx-9750GIII only)
- Chapter 15 Distribution (fx-9860GIII, fx-9750GIII only)
- Appendix
- Examination Modes (fx-9860GIII, fx-9750GIII only)
- E-CON3 Application (English) (fx-9860GIII, fx-9750GIII)
- 1 E-CON3 Overview
- 2 Using the Setup Wizard
- 3 Using Advanced Setup
- 4 Using a Custom Probe
- 5 Using the MULTIMETER Mode
- 6 Using Setup Memory
- 7 Using Program Converter
- 8 Starting a Sampling Operation
- 9 Using Sample Data Memory
- 10 Using the Graph Analysis Tools to Graph Data
- 11 Graph Analysis Tool Graph Screen Operations
- 12 Calling E-CON3 Functions from an eActivity

2-6
Using the Setup Wizard
u To configure a setup for Photogate and Smart Pulley
1. On the E-CON3 main menu, press 1(SET) 1(WIZ) to start the setup wizard.
2. This displays the “Select Sensor” dialog box.
3. If you are using a Vernier Photogate with Pulley, select [VERNIER] - [Photogate] -
[Pulley]. When the “Select Channel” dialog box appears, advance to step 4 of this
procedure.
If you are using a CMA Photogate with Pulley, select [CMA] - [Photogate] - [Pulley]. When
the “Input Distance(m)” dialog box appears, advance to step 5 of this procedure.
4. Press 1(CH1) or 2(SONIC) to specify the channel where the Photogate is connected.
• This displays the “Input Distance(m)” dialog box.
5. On the “Input Distance(m)” dialog box, input a value in the range of 0.1 to 4.0 and then
press w.
6. Perform step 10 (in the case of a Vernier Photogate) or steps 9 and 10 (in the case of a
CMA Photogate) under “To configure a Data Logger setup using Setup Wizard” (page
2-2).
k Outputting the Waveform of a Function through the Speaker
(EA-200 only)
Normally, the Setup Wizard helps you configure setups for sensors connected to a Data
Logger. If you select [CASIO] - [Speaker] - [y=f(x)] on the “Select Sensor” screen, however, it
configures the EA-200 to output the sound that corresponds to a function that you input and
graph on the calculator.
u
To configure a setup for speaker output
1. Connect the data communication cable (SB-62) to the communication port of the
calculator and the MASTER port of the EA-200.
2. Perform the first two steps of the procedure under “To configure a Data Logger setup
using Setup Wizard” on page 2-2.
3. On the “Select Sensor” screen, select [CASIO] - [Speaker] - [y=f(x)].
This displays a screen like the one shown below.
4. Press w to advance to the View Window setting screen.
• The following settings are configured automatically: Ymin = –1.5 and Ymax = 1.5. Do not
change these settings.
5. Press w or J to advance to the graph function list.