
User Manual
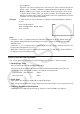

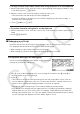

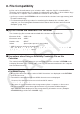


Table Of Contents
- Contents
- Getting Acquainted — Read This First!
- Chapter 1 Basic Operation
- Chapter 2 Manual Calculations
- 1. Basic Calculations
- 2. Special Functions
- 3. Specifying the Angle Unit and Display Format
- 4. Function Calculations
- 5. Numerical Calculations
- 6. Complex Number Calculations
- 7. Binary, Octal, Decimal, and Hexadecimal Calculations with Integers
- 8. Matrix Calculations
- 9. Vector Calculations
- 10. Metric Conversion Calculations
- Chapter 3 List Function
- Chapter 4 Equation Calculations
- Chapter 5 Graphing
- 1. Sample Graphs
- 2. Controlling What Appears on a Graph Screen
- 3. Drawing a Graph
- 4. Storing a Graph in Picture Memory
- 5. Drawing Two Graphs on the Same Screen
- 6. Manual Graphing
- 7. Using Tables
- 8. Dynamic Graphing
- 9. Graphing a Recursion Formula
- 10. Graphing a Conic Section
- 11. Changing the Appearance of a Graph
- 12. Function Analysis
- Chapter 6 Statistical Graphs and Calculations
- 1. Before Performing Statistical Calculations
- 2. Calculating and Graphing Single-Variable Statistical Data
- 3. Calculating and Graphing Paired-Variable Statistical Data
- 4. Performing Statistical Calculations
- 5. Tests
- 6. Confidence Interval
- 7. Distribution
- 8. Input and Output Terms of Tests, Confidence Interval, and Distribution
- 9. Statistic Formula
- Chapter 7 Financial Calculation (TVM)
- Chapter 8 Programming
- Chapter 9 Spreadsheet
- Chapter 10 eActivity
- Chapter 11 Memory Manager
- Chapter 12 System Manager
- Chapter 13 Data Communication
- Chapter 14 PYTHON (fx-9860GIII, fx-9750GIII only)
- Chapter 15 Distribution (fx-9860GIII, fx-9750GIII only)
- Appendix
- Examination Modes (fx-9860GIII, fx-9750GIII only)
- E-CON3 Application (English) (fx-9860GIII, fx-9750GIII)
- 1 E-CON3 Overview
- 2 Using the Setup Wizard
- 3 Using Advanced Setup
- 4 Using a Custom Probe
- 5 Using the MULTIMETER Mode
- 6 Using Setup Memory
- 7 Using Program Converter
- 8 Starting a Sampling Operation
- 9 Using Sample Data Memory
- 10 Using the Graph Analysis Tools to Graph Data
- 11 Graph Analysis Tool Graph Screen Operations
- 12 Calling E-CON3 Functions from an eActivity

14-22
k Drawing Screen
The drawing screen is a special screen for drawing.
u Drawing Screen Refresh Timing
To refresh the drawing screen while it is displayed, execute the show_screen function.
If you put
show_screen outside of a loop statement, executing the py script will cause only the
final result to appear on the drawing screen. Putting show_screen inside of a loop statement
will display the result of each draw operation until the final result is reached.
(a) Example:
show_screen outside of a py script loop statement (display of the final
result)
from casioplot import *
for i in range(60):
set_pixel(i,i)
show_screen()
(b) Example:
show_screen inside of a py script loop statement (display of each draw
operation)
from casioplot import *
for i in range(60):
set_pixel(i,i)
show_screen()
Note: The currently displayed drawing screen is refreshed after execution of the py script is
complete.
u To return to the SHELL screen from the drawing screen
Press J, A, or !J(QUIT).
Note: The display will change from the drawing screen to the SHELL screen if any one of the
events below occurs during py script execution.
- Execution of
input
- Generation of an error
- Pressing of A
u Drawing Screen Content Clear Timing
Drawing screen contents are cleared at the timing below.
- When
clear_screen is executed (page 14-18)
- When SHELL is initialized (page 14-16)