
User Manual
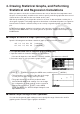
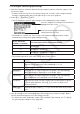

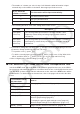
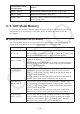
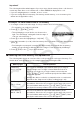
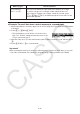


Table Of Contents
- Contents
- Getting Acquainted — Read This First!
- Chapter 1 Basic Operation
- Chapter 2 Manual Calculations
- 1. Basic Calculations
- 2. Special Functions
- 3. Specifying the Angle Unit and Display Format
- 4. Function Calculations
- 5. Numerical Calculations
- 6. Complex Number Calculations
- 7. Binary, Octal, Decimal, and Hexadecimal Calculations with Integers
- 8. Matrix Calculations
- 9. Vector Calculations
- 10. Metric Conversion Calculations
- Chapter 3 List Function
- Chapter 4 Equation Calculations
- Chapter 5 Graphing
- 1. Sample Graphs
- 2. Controlling What Appears on a Graph Screen
- 3. Drawing a Graph
- 4. Storing a Graph in Picture Memory
- 5. Drawing Two Graphs on the Same Screen
- 6. Manual Graphing
- 7. Using Tables
- 8. Dynamic Graphing
- 9. Graphing a Recursion Formula
- 10. Graphing a Conic Section
- 11. Changing the Appearance of a Graph
- 12. Function Analysis
- Chapter 6 Statistical Graphs and Calculations
- 1. Before Performing Statistical Calculations
- 2. Calculating and Graphing Single-Variable Statistical Data
- 3. Calculating and Graphing Paired-Variable Statistical Data
- 4. Performing Statistical Calculations
- 5. Tests
- 6. Confidence Interval
- 7. Distribution
- 8. Input and Output Terms of Tests, Confidence Interval, and Distribution
- 9. Statistic Formula
- Chapter 7 Financial Calculation (TVM)
- Chapter 8 Programming
- Chapter 9 Spreadsheet
- Chapter 10 eActivity
- Chapter 11 Memory Manager
- Chapter 12 System Manager
- Chapter 13 Data Communication
- Chapter 14 PYTHON (fx-9860GIII, fx-9750GIII only)
- Chapter 15 Distribution (fx-9860GIII, fx-9750GIII only)
- Appendix
- Examination Modes (fx-9860GIII, fx-9750GIII only)
- E-CON3 Application (English) (fx-9860GIII, fx-9750GIII)
- 1 E-CON3 Overview
- 2 Using the Setup Wizard
- 3 Using Advanced Setup
- 4 Using a Custom Probe
- 5 Using the MULTIMETER Mode
- 6 Using Setup Memory
- 7 Using Program Converter
- 8 Starting a Sampling Operation
- 9 Using Sample Data Memory
- 10 Using the Graph Analysis Tools to Graph Data
- 11 Graph Analysis Tool Graph Screen Operations
- 12 Calling E-CON3 Functions from an eActivity

9-19
• If you want to change the XCellRange, YCellRange, or Frequency setting, move the
highlighting to the item you want to change and then input the cell range directly, or select
1(CELL) ( 2(CELL) for Frequency) and then edit the currently input range. When
inputting a cell range manually, use 1(:) to enter a colon (:) between two cells that define
the range.
4. After configuring the required settings, press J or w.
k Example of Statistical Calculation Operation (CALC Menu)
This example uses the data from the “Drawing a Scatter Diagram and xy Line Graph” (page
6-10) to perform paired-variable statistical calculations.
0.5, 1.2, 2.4, 4.0, 5.2 (
x -data)
–2.1, 0.3, 1.5, 2.0, 2.4 (
y -data)
u To perform paired-variable statistical calculations and regression
calculations
1. Input the above x -data into cells A1:A5 of the
spreadsheet and the y -data into cells B1:B5, and then
select the range of the cells where you input the data
(A1:B5).
2. Press 6( g) 2(CALC) to display the CALC menu, and
then press 2(2VAR).
• This will display a screen of paired variable calculation
results based on the data you selected in step 1. Use
e and d to scroll the result screen. To close the
screen, press J.
• For information about the meaning of each of the values
on the result screen, see “Displaying the Calculation
Results of a Drawn Paired-Variable Graph” on
page
6-15.
3. To return to the spreadsheet screen, press J.
k Using the Statistical Calculation Data Range Specification Screen
You can use a special setting screen to specify the range of data to be used for statistical
calculation.
u To specify the data range for statistical calculation
1. Input the statistical calculation data into the spreadsheet and then select its range of cells.
2. Press 6( g) 2(CALC) 6(SET).
• This will display a setting screen like the one shown to
the right.