
User Manual

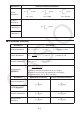


Table Of Contents
- Contents
- Getting Acquainted — Read This First!
- Chapter 1 Basic Operation
- Chapter 2 Manual Calculations
- 1. Basic Calculations
- 2. Special Functions
- 3. Specifying the Angle Unit and Display Format
- 4. Function Calculations
- 5. Numerical Calculations
- 6. Complex Number Calculations
- 7. Binary, Octal, Decimal, and Hexadecimal Calculations with Integers
- 8. Matrix Calculations
- 9. Vector Calculations
- 10. Metric Conversion Calculations
- Chapter 3 List Function
- Chapter 4 Equation Calculations
- Chapter 5 Graphing
- 1. Sample Graphs
- 2. Controlling What Appears on a Graph Screen
- 3. Drawing a Graph
- 4. Storing a Graph in Picture Memory
- 5. Drawing Two Graphs on the Same Screen
- 6. Manual Graphing
- 7. Using Tables
- 8. Dynamic Graphing
- 9. Graphing a Recursion Formula
- 10. Graphing a Conic Section
- 11. Changing the Appearance of a Graph
- 12. Function Analysis
- Chapter 6 Statistical Graphs and Calculations
- 1. Before Performing Statistical Calculations
- 2. Calculating and Graphing Single-Variable Statistical Data
- 3. Calculating and Graphing Paired-Variable Statistical Data
- 4. Performing Statistical Calculations
- 5. Tests
- 6. Confidence Interval
- 7. Distribution
- 8. Input and Output Terms of Tests, Confidence Interval, and Distribution
- 9. Statistic Formula
- Chapter 7 Financial Calculation (TVM)
- Chapter 8 Programming
- Chapter 9 Spreadsheet
- Chapter 10 eActivity
- Chapter 11 Memory Manager
- Chapter 12 System Manager
- Chapter 13 Data Communication
- Chapter 14 PYTHON (fx-9860GIII, fx-9750GIII only)
- Chapter 15 Distribution (fx-9860GIII, fx-9750GIII only)
- Appendix
- Examination Modes (fx-9860GIII, fx-9750GIII only)
- E-CON3 Application (English) (fx-9860GIII, fx-9750GIII)
- 1 E-CON3 Overview
- 2 Using the Setup Wizard
- 3 Using Advanced Setup
- 4 Using a Custom Probe
- 5 Using the MULTIMETER Mode
- 6 Using Setup Memory
- 7 Using Program Converter
- 8 Starting a Sampling Operation
- 9 Using Sample Data Memory
- 10 Using the Graph Analysis Tools to Graph Data
- 11 Graph Analysis Tool Graph Screen Operations
- 12 Calling E-CON3 Functions from an eActivity

7-5
After configuring the parameters, use one of the function menus noted below to perform the
corresponding calculation.
• { n } … {number of compound periods}
• { I% } … {annual interest rate}
• { PV } … {present value} (Loan: loan amount; Savings: balance)
• { PMT } … {payment} (Loan: installment; Savings: deposit)
• { FV } … {future value} (Loan: unpaid balance; Savings: principal plus interest)
• { AMT } … {amortization screen}
• An error (Ma ERROR) occurs if parameters are not configured correctly.
Use the following function menus to maneuver between calculation result screens.
• { REPT } … {parameter input screen}
• { AMT } … {amortization screen}
• { GRPH } … {draws graph}
After drawing a graph, you can press !1(TRCE) to turn on trace and read calculation
results along the graph.
Press J to return to the parameter input screen.
4. Cash Flow (Investment Appraisal)
This calculator uses the discounted cash flow (DCF) method to perform investment appraisal
by totalling cash flow for a fixed period. This calculator can perform the following four types of
investment appraisal.
• Net present value (
NPV )
• Net future value (
NFV )
• Internal rate of return (
IRR )
• Payback period (
PBP )
A cash flow diagram like the one shown below helps to visualize the movement of funds.
With this graph, the initial investment amount is represented by CF 0 . The cash flow one year
later is shown by CF 1 , two years later by CF 2 , and so on.
CF0
CF1
CF2
CF3
CF4
CF5
CF6
CF7