
User Manual
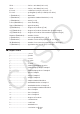
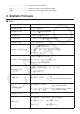

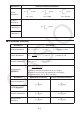

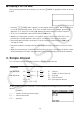

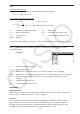


Table Of Contents
- Contents
- Getting Acquainted — Read This First!
- Chapter 1 Basic Operation
- Chapter 2 Manual Calculations
- 1. Basic Calculations
- 2. Special Functions
- 3. Specifying the Angle Unit and Display Format
- 4. Function Calculations
- 5. Numerical Calculations
- 6. Complex Number Calculations
- 7. Binary, Octal, Decimal, and Hexadecimal Calculations with Integers
- 8. Matrix Calculations
- 9. Vector Calculations
- 10. Metric Conversion Calculations
- Chapter 3 List Function
- Chapter 4 Equation Calculations
- Chapter 5 Graphing
- 1. Sample Graphs
- 2. Controlling What Appears on a Graph Screen
- 3. Drawing a Graph
- 4. Storing a Graph in Picture Memory
- 5. Drawing Two Graphs on the Same Screen
- 6. Manual Graphing
- 7. Using Tables
- 8. Dynamic Graphing
- 9. Graphing a Recursion Formula
- 10. Graphing a Conic Section
- 11. Changing the Appearance of a Graph
- 12. Function Analysis
- Chapter 6 Statistical Graphs and Calculations
- 1. Before Performing Statistical Calculations
- 2. Calculating and Graphing Single-Variable Statistical Data
- 3. Calculating and Graphing Paired-Variable Statistical Data
- 4. Performing Statistical Calculations
- 5. Tests
- 6. Confidence Interval
- 7. Distribution
- 8. Input and Output Terms of Tests, Confidence Interval, and Distribution
- 9. Statistic Formula
- Chapter 7 Financial Calculation (TVM)
- Chapter 8 Programming
- Chapter 9 Spreadsheet
- Chapter 10 eActivity
- Chapter 11 Memory Manager
- Chapter 12 System Manager
- Chapter 13 Data Communication
- Chapter 14 PYTHON (fx-9860GIII, fx-9750GIII only)
- Chapter 15 Distribution (fx-9860GIII, fx-9750GIII only)
- Appendix
- Examination Modes (fx-9860GIII, fx-9750GIII only)
- E-CON3 Application (English) (fx-9860GIII, fx-9750GIII)
- 1 E-CON3 Overview
- 2 Using the Setup Wizard
- 3 Using Advanced Setup
- 4 Using a Custom Probe
- 5 Using the MULTIMETER Mode
- 6 Using Setup Memory
- 7 Using Program Converter
- 8 Starting a Sampling Operation
- 9 Using Sample Data Memory
- 10 Using the Graph Analysis Tools to Graph Data
- 11 Graph Analysis Tool Graph Screen Operations
- 12 Calling E-CON3 Functions from an eActivity

7-2
k Graphing in the TVM Mode
After performing a financial calculation, you can use 6(GRPH) to graph the results as shown
below.
• Pressing !1(TRCE) while a graph is on the display activates Trace, which can be used
to look up other financial values. In the case of simple interest, for example, pressing e
displays
PV , SI , and SFV . Pressing d displays the same values in reverse sequence.
• Zoom, Scroll, and Sketch cannot be used in the TVM mode.
• Whether you should use a positive or a negative value for the present value (PV) or the
purchase price (PRC) depends on the type of calculation you are trying to perform.
• Note that graphs should be used only for reference purposes when viewing TVM mode
calculation results.
• Note that calculation results produced in this mode should be regarded as reference values
only.
• Whenever performing an actual financial transaction, be sure to check any calculation results
obtained using this calculator with against the figures calculated by your financial institution.
2. Simple Interest
This calculator uses the following formulas to calculate simple interest.
u Formula
365-day Mode SI : interest
n : number of interest periods
360-day Mode PV : principal
I % : annual interest
SFV : principal plus interest
Press 1(SMPL) from the Financial 1 screen to display the following input screen for simple
interest.
1(SMPL)
n ........... number of interest periods (days)
I % ........ annual interest rate
P V ........ principal
SI' =
n
365
× PV × i
SI' =
n
360
× PV × i
I%
100
i =
I%
100
i =
SI = –SI'
SFV = –(PV + SI' )