
User Manual
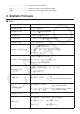


Table Of Contents
- Contents
- Getting Acquainted — Read This First!
- Chapter 1 Basic Operation
- Chapter 2 Manual Calculations
- 1. Basic Calculations
- 2. Special Functions
- 3. Specifying the Angle Unit and Display Format
- 4. Function Calculations
- 5. Numerical Calculations
- 6. Complex Number Calculations
- 7. Binary, Octal, Decimal, and Hexadecimal Calculations with Integers
- 8. Matrix Calculations
- 9. Vector Calculations
- 10. Metric Conversion Calculations
- Chapter 3 List Function
- Chapter 4 Equation Calculations
- Chapter 5 Graphing
- 1. Sample Graphs
- 2. Controlling What Appears on a Graph Screen
- 3. Drawing a Graph
- 4. Storing a Graph in Picture Memory
- 5. Drawing Two Graphs on the Same Screen
- 6. Manual Graphing
- 7. Using Tables
- 8. Dynamic Graphing
- 9. Graphing a Recursion Formula
- 10. Graphing a Conic Section
- 11. Changing the Appearance of a Graph
- 12. Function Analysis
- Chapter 6 Statistical Graphs and Calculations
- 1. Before Performing Statistical Calculations
- 2. Calculating and Graphing Single-Variable Statistical Data
- 3. Calculating and Graphing Paired-Variable Statistical Data
- 4. Performing Statistical Calculations
- 5. Tests
- 6. Confidence Interval
- 7. Distribution
- 8. Input and Output Terms of Tests, Confidence Interval, and Distribution
- 9. Statistic Formula
- Chapter 7 Financial Calculation (TVM)
- Chapter 8 Programming
- Chapter 9 Spreadsheet
- Chapter 10 eActivity
- Chapter 11 Memory Manager
- Chapter 12 System Manager
- Chapter 13 Data Communication
- Chapter 14 PYTHON (fx-9860GIII, fx-9750GIII only)
- Chapter 15 Distribution (fx-9860GIII, fx-9750GIII only)
- Appendix
- Examination Modes (fx-9860GIII, fx-9750GIII only)
- E-CON3 Application (English) (fx-9860GIII, fx-9750GIII)
- 1 E-CON3 Overview
- 2 Using the Setup Wizard
- 3 Using Advanced Setup
- 4 Using a Custom Probe
- 5 Using the MULTIMETER Mode
- 6 Using Setup Memory
- 7 Using Program Converter
- 8 Starting a Sampling Operation
- 9 Using Sample Data Memory
- 10 Using the Graph Analysis Tools to Graph Data
- 11 Graph Analysis Tool Graph Screen Operations
- 12 Calling E-CON3 Functions from an eActivity

6-54
XList ...................................list for x -axis data (List 1 to 6)
YList ...................................list for
y -axis data (List 1 to 6)
C-Level...............................confidence level (0 C-Level < 1)
Pooled ................................pooling On (in effect) or Off (not in effect)
x (Distribution) ....................data value
(Distribution) ...................population standard deviation ( > 0)
(Distribution) ...................mean ( > 0)
Lower (Distribution) ............lower boundary
Upper (Distribution) ............upper boundary
d f (Distribution) ..................degrees of freedom ( df > 0)
n : df (Distribution) ...............degrees of freedom of numerator (positive integer)
d : df (Distribution) ...............degrees of freedom of denominator (positive integer)
Numtrial (Distribution) ........number of trials
p (Distribution) ...................success probability (0 p 1)
n (Distribution) ...................number of trials from population (0 n integer)
M (Distribution) ..................number of successes in population (0 M integer)
N (Distribution) ...................population size (n N, M N integer)
k Output Terms
z ......................................... z score
p ......................................... p -value
t .......................................... t score
2
........................................
2
value
F ........................................ F value
pˆ ..........................................estimated sample proportion
pˆ
1
........................................estimated proportion of sample 1
pˆ
2
........................................estimated proportion of sample 2
o .........................................mean of sample
o
1
........................................mean of sample 1
o
2
........................................mean of sample 2
s
x
........................................sample standard deviation
s
x
1
.......................................standard deviation of sample 1
s
x
2
.......................................standard deviation of sample 2
s
p
........................................pooled sample standard deviation
n ........................................size of sample
n
1
........................................size of sample 1
n
2
........................................size of sample 2
d f ........................................degrees of freedom
a .........................................constant term
b .........................................coefficient
s
e
........................................standard error
r .........................................correlation coefficient