
User Manual
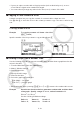


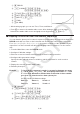
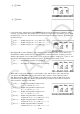
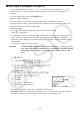

Table Of Contents
- Contents
- Getting Acquainted — Read This First!
- Chapter 1 Basic Operation
- Chapter 2 Manual Calculations
- 1. Basic Calculations
- 2. Special Functions
- 3. Specifying the Angle Unit and Display Format
- 4. Function Calculations
- 5. Numerical Calculations
- 6. Complex Number Calculations
- 7. Binary, Octal, Decimal, and Hexadecimal Calculations with Integers
- 8. Matrix Calculations
- 9. Vector Calculations
- 10. Metric Conversion Calculations
- Chapter 3 List Function
- Chapter 4 Equation Calculations
- Chapter 5 Graphing
- 1. Sample Graphs
- 2. Controlling What Appears on a Graph Screen
- 3. Drawing a Graph
- 4. Storing a Graph in Picture Memory
- 5. Drawing Two Graphs on the Same Screen
- 6. Manual Graphing
- 7. Using Tables
- 8. Dynamic Graphing
- 9. Graphing a Recursion Formula
- 10. Graphing a Conic Section
- 11. Changing the Appearance of a Graph
- 12. Function Analysis
- Chapter 6 Statistical Graphs and Calculations
- 1. Before Performing Statistical Calculations
- 2. Calculating and Graphing Single-Variable Statistical Data
- 3. Calculating and Graphing Paired-Variable Statistical Data
- 4. Performing Statistical Calculations
- 5. Tests
- 6. Confidence Interval
- 7. Distribution
- 8. Input and Output Terms of Tests, Confidence Interval, and Distribution
- 9. Statistic Formula
- Chapter 7 Financial Calculation (TVM)
- Chapter 8 Programming
- Chapter 9 Spreadsheet
- Chapter 10 eActivity
- Chapter 11 Memory Manager
- Chapter 12 System Manager
- Chapter 13 Data Communication
- Chapter 14 PYTHON (fx-9860GIII, fx-9750GIII only)
- Chapter 15 Distribution (fx-9860GIII, fx-9750GIII only)
- Appendix
- Examination Modes (fx-9860GIII, fx-9750GIII only)
- E-CON3 Application (English) (fx-9860GIII, fx-9750GIII)
- 1 E-CON3 Overview
- 2 Using the Setup Wizard
- 3 Using Advanced Setup
- 4 Using a Custom Probe
- 5 Using the MULTIMETER Mode
- 6 Using Setup Memory
- 7 Using Program Converter
- 8 Starting a Sampling Operation
- 9 Using Sample Data Memory
- 10 Using the Graph Analysis Tools to Graph Data
- 11 Graph Analysis Tool Graph Screen Operations
- 12 Calling E-CON3 Functions from an eActivity

5-19
• If you try to replace a value with an illegal operation (such as division by zero), an error
occurs and the original value remains unchanged.
• You cannot directly change any values in the other (non-
x ) columns of the table.
k Copying a Table Column to a List
A simple operation lets you copy the contents of a numeric table column into a list.
Use d and e to move the cursor to the column you want to copy. The cursor can be in any
row.
u To copy a table to a list
Example To copy the contents of Column x into List 1
K1(LMEM)
Input the number of the list you want to copy and then press w.
bw
k Drawing a Graph from a Number Table
Use the following procedure to generate a number table and then draw a graph based on the
values in the table.
1. From the Main Menu, enter the TABLE mode.
2. Make V-Window settings.
3. Store the functions.
4. Specify the table range.
5. Generate the table.
6. Select the graph type and draw it.
5(G
• CON) ... line graph
6(G
• PLT) ... plot type graph
• After drawing the graph, pressing !6(G ↔ T) or A returns to the number table screen.
Example Store the two functions below, generate a number table, and then draw
a line graph. Specify a range of –3 to 3, and an increment of 1.
Y1 = 3
x
2
– 2, Y2 = x
2
Use the following V-Window settings.
Xmin = 0, Xmax = 6, Xscale = 1
Ymin = –2, Ymax = 10, Yscale = 2