
User Manual


6-43
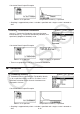
Tail: Left
upper boundary
of integration
interval
f (x)dx = p
−∞
∫
Upper
f (x)dx = p
+∞
∫
Lower
f (x)dx = p
∫
Upper
Lower
f (x)dx = p
−∞
∫
Upper
f (x)dx = p
+∞
∫
Lower
f (x)dx = p
∫
Upper
Lower
Tail: Right
lower boundary
of integration
interval
Tail: Central
upper and lower
boundaries of
integration interval
Specify the probability and use this formula to obtain the integration interval.
• This calculator performs the above calculation using the following: ∞ = 1E99, – ∞ = –1E99
• There is no graphing for Inverse Normal Cumulative Distribution.
k Student- t Distribution
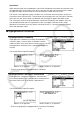
• Student- t Probability Density 5(DIST) 2(t) 1(tPd)
Student-
t Probability Density calculates the probability
density (
p ) for a specified single x -value or a list. When a
list is specified, calculation results for each list element are
displayed in list form.
Calculation Result Output Examples
When a list is specified Graph when variable ( x ) is specified
• Graphing is supported only when a variable is specified and a single x -value is entered as
data.
• Student- t Cumulative Distribution 5(DIST) 2(t) 2(tCd)
Student-
t Cumulative Distribution calculates the Student- t
cumulative probability of a Student-
t distribution between a
lower bound and an upper bound.
Calculation Result Output Examples
When a list is specified Graph when variable ( x ) is specified