
User Manual


6-21
4. Press m, select the RUN • MAT (or RUN ) mode, press K6( g) 3(PROB)
( 2(PROB) on the fx-7400G
II ) to recall the probability calculation (PROB) menu.
3(PROB) * 6( g) 4(
t () bga.f)w
* fx-7400G
II : 2(PROB)
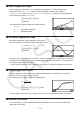
(Normalized variate
t for 160.5 cm) Result: –1.633855948
(
–1.634)
4( t () bhf.f)w
(Normalized variate
t for 175.5 cm) Result: 0.4963343361
( 0.496)
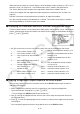
1(P() a.ejg)-
1(P() -b.gde)w
(Percentage of total) Result: 0.638921
(63.9% of total)
3(R() a.ejg)w
(Percentile) Result: 0.30995
(31.0 percentile)
k Drawing a Normal Probability Distribution Graph
You can draw a normal probability distribution graph using manual graphing with the
RUN • MAT (or RUN ) mode.
1. From the Main Menu, enter the RUN • MAT (or RUN ) mode.
2. Input the commands to draw a rectangular coordinate graph.
3. Input the probability value.
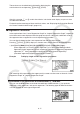
Example To draw a normal probability P (0.5) graph.
1 m RUN • MAT (or RUN)
2 !4(SKTCH) 1(Cls) w
5(GRPH) 1(Y=)
3 K6( g) 3(PROB) * 6( g) 1(P() a.f)w
* fx-7400G
II : 2(PROB)
k Calculations Using the Distribution Function
Important!
• The following operations cannot be performed on the fx-7400G II .
You can use special functions in the RUN • MAT mode or PRGM mode to perform calculations
that are the same as the STAT mode distribution function calculation (page 6-40).
Example To calculate normal probability distribution in the RUN • MAT mode for
the data {1, 2, 3}, when the population standard deviation is
σ
= 1.5 and
the population mean is
= 2.