
User Manual


5-4
• The following is the input range for V-Window parameters.
–9.999999999
E
97 to 9.999999999
E
97
k V-Window Memory
You can store up to six sets of V-Window settings in V-Window memory for recall when you
need them.
u To store V-Window settings
1. From the Main Menu, enter the GRAPH mode.
2. Press !3(V-WIN) to display the V-Window setting screen, and input the values you want.
3. Press 4(STO) to display the pop-up window.
4. Press a number key to specify the V-Window memory where you want to save the settings,
and then press w. Pressing bw stores the settings in V-Window Memory 1 (V-Win1).
u To recall V-Window memory settings
1. From the Main Menu, enter the GRAPH mode.
2. Press !3(V-WIN) to display the V-Window setting screen.
3. Press 5(RCL) to display the pop-up window.
4. Press a number key to specify the V-Window memory number for the settings you want to recall,
and then press w. Pressing bw recalls the settings in V-Window Memory 1 (V-Win1).
k Specifying the Graph Range
You can define a range (start point, end point) for a function before graphing it.
1. From the Main Menu, enter the GRAPH mode.
2. Make V-Window settings.
3. Specify the function type and input the function. The following is the syntax for function input.
Function ,!+( [ ) Start Point , End Point !-( ] )
4. Draw the graph.
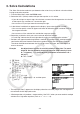
Example Graph
y = x
2
+ 3 x – 2 within the range – 2 < x < 4.
Use the following V-Window settings.
Xmin = –3, Xmax = 5, Xscale = 1
Ymin = –10, Ymax = 30, Yscale = 5
1 m GRAPH
2 !3(V-WIN) -dwfwbwc
-bawdawfwJ
3 3(TYPE) 1(Y=) vx+dv-c,
!+( [ ) -c,e!-( ] ) w
4 6(DRAW)
• You can specify a range when graphing rectangular expressions, polar expressions,
parametric functions, and inequalities.