
User manual - Spreadsheet


20040801
8-20
Graphing
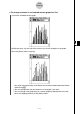
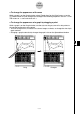
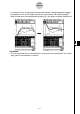
• If a regression curve is displayed for the data whose graph is being changed by dragging,
the regression curve also changes automatically in accordance with the drag changes.
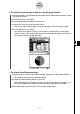
•When you edit data in the spreadsheet and press E, your graph will update automatically.
Important!
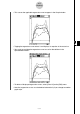
•You can drag a point only if it corresponds to a fixed value on the spreadsheet. You cannot
drag a point if it corresponds to a formula.