
User Manual


Chapter 3: Graph & Table Application 17
0312
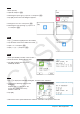
1. If the graph controller is not displayed on the Graph window, perform the operation below.
(1) Tap O and then [Graph Format] to display the Graph Format dialog box.
(2) Select the “G-Controller” check box.
(3) Tap [Set].
2. On the Graph Editor window, input 2
x
2
+ 3x – 1 in line y1, and 2x + 1 in line y2.
3. Tap $ to graph the function.
4. Tap [Analysis] and then [Modify].
• This displays a dialog box for inputting the step.
5. Input the amount of change (step) in the parameter value, and then tap [OK].
• This causes “Modify” to appear on the Graph window and the
y1 graph (2x
2
+ 3x – 1) to become active,
which is indicated by a thick graph line.
• The function of the currently active graph is displayed in the Graph window message box.
6. In the function displayed in the message box, select the parameter you want to change.
7. Tap the left or right graph controller button to change the value of the parameter you selected in step 5.
• To increase the value of the parameter, tap the right graph controller arrow.
• To decrease the value of the parameter, tap the left graph controller arrow.
• At this point, you could select other parameters and change their values as well, if you want.
8. To modify the y2 graph (2x + 1), tap the down graph controller arrow to make it the graph active.
• Repeat steps 6 and 7 to modify the currently selected graph.
9. To quit graph modification, tap l on the icon panel.
0313
1. On the Graph Editor window, input ax
2
– bx in line y1, and ax + b in line y2.
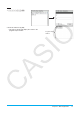
2. Tap a and then [Dynamic Graph] or tap 4.
3. On the menu that appears when you tap the upper left corner of the slider display box, tap [Settings].
4. On the Slider Settings dialog box that appears, use the [Slider 1] and [Slider 2] tabs to input the values
shown in the table below for the minimum values, maximum values, and step values of parameters
a and b.
Tab Parameter Min Max Step
[Slider 1]
a
141
[Slider 2]
b
–2 2 1
5. Tap [OK] to close the dialog box.