
User Manual


Chapter 3: Graph & Table Application 15
0307
1. On the Graph Editor window, input and store y = x + 1 into line y1 and y = x
2
into y2, and then tap $ to
graph them.
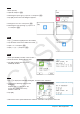
2. Tap [Analysis], [G-Solve], and then [Intersection].
• This causes “Intersection” to appear on the Graph window, with a pointer
located at the point of intersection. The
x- and y-coordinates at the current
pointer location are also shown on the Graph window.
3. To obtain other points of intersection, press the left or right cursor key, or tap
the left or right graph controller arrows.
0308
1. On the Graph Editor window, input and store y = x (x + 2)(x – 2) into line y1, and then tap $ to graph it.
2. To obtain the value of
y for a particular x-value, tap [Analysis], [G-Solve], [x-Cal/y-Cal], and then [y-Cal].
• This displays a dialog box for specifying the
x-value.
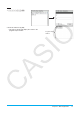
3. For this example, input 0.5 and then tap [OK].
• This moves the pointer to the location on the graph where
x = 0.5, and
displays the x-coordinate and y-coordinate at that location.
4. To obtain the value of x for a particular y-value, tap [Analysis], [G-Solve], [x-Cal/y-Cal], and then [x-Cal].
• This displays a dialog box for specifying the
y-value.
5. For this example, input 2.2 and then tap [OK].
• This moves the pointer to the location on the graph where
y = 2.2, and
displays the x-coordinate and y-coordinate at that location.
Tip: When there are multiple results for the above procedure, press e to calculate the next value. Pressing d returns
to the previous value.