
User manual - ClassPadII_Ex

Chapter 12: Program Application 40
Note: MedMed, QuadR, CubicR,
QuartR, LinearR, ExpR, abExpR,
or PowerR can also be specified in
instead of LogR for the graph type.
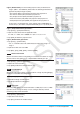
1207
Program:
{0.5,1.2,2.4,4,5.2}Slist1_
{–2.1,0.3,1.5,2,2.4}Slist2_
StatGraph䡺1, On, SinR, list1,
list2_
DrawStat
Result screen:
Note: LogisticR can also be
specified in instead of SinR for the
graph type.
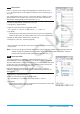
1208
Program:
StatGraphSel䡺Off
{0.5,1.2,2.4,4,5.2}Slist1_
{–2.1,0.3,1.5,2,2.4}Slist2_
StatGraph䡺1, On, Scatter, list1,
list2, 1, Square_
DrawStat_
LogReg䡺list1, list2, 1_
DispStat_
DrawStat
Result screen:
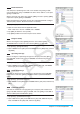
1209
Program:
{7,4,6,6,5,6,5,5,8,7,4,7,6,7,6}
Slist1_
{1,1,1,1,1,2,2,2,2,2,3,3,3,3,3}
Slist2_
OneWayANOVA䡺list1, list2_
DispStat
Result screen:
1210
Program:
{1,1,1,1,2,2,2,2}Slist1_
{1,1,2,2,1,1,2,2}Slist2_
{113,116,139,132,133,131,126,
122}Slist3_
TwoWayANOVA list1, list2, list3_
DispStat
Result screen:
1211
Program:
OneSampleZTest䡺"≠",0,3,24.5,
48_
DispStat
Result screen:
1212
Program:
Input Month_
Input Date_
Input Year_
DateMode365_
dayCount(07,04,1976,Month,
Date,Year)Sdays_
Print "Days="_
Print days
Result screen:
Shows the result for the following
input: Month: 7, Date: 4, Year:
2013.
1213
Program:
DateMode360_
PeriodsSemi_
bondPriceDate(6,1,2004,12,15,
2006,100,3,4)Slist1_
list1[1]Sprice_
Print "PRC="_
Print approx(price)
Result screen:
LY777Ex_E.indb 40 13/02/25 11:24