
User manual - ClassPadII_Ex

Chapter 12: Program Application 39
Chapter 12:
Program Application
Note: The notation in the “Program” uses 䡺 to represent a space and _ for a carriage return.
1201
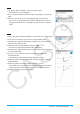
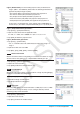
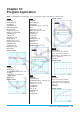
Program:
DefaultSetup_
ClrGraph_
ViewWindow_
SetInequalityPlot䡺
Intersection_
GraphType䡺"y>"_
Define䡺y1(x)=sin(x)_
GTSelOn䡺1_
PTDot䡺1_
SheetActive䡺1_
DrawGraph_
GraphType䡺"y<"_
Define䡺y2(x)=−x/12_
GTSelOn䡺2_
PTNormal䡺2_
SheetActive䡺1_
DrawGraph
Result screen:
1202
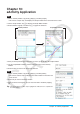
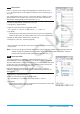
Program:
ClrGraph_
ViewWindow䡺–15.4,15.4,2,–7.6,
7.6,2_
"(x–1)^2/3^2+(y–2)^2/4^2= 1"
SConicsEq_
DrawConics
Result screen:
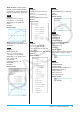
1203
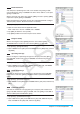
Program:
DefaultSetup_
ClrGraph_
ViewWindow䡺0,7.7,1,–14,110,
10_
GraphType䡺"y="_
Define䡺y1(x)=3×x^2–2_
GTSelOn䡺1_
0SFStart_
6SFEnd_
1SFStep_
SheetActive䡺1_
DispFTable_
Pause_
DrawFTGCon
Result screen:
1204
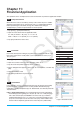
Program:
DefaultSetup_
ViewWindow䡺0,6,1,−0.01,0.3,1_
SeqType "a
n+1
a
0
"_
"−3a
n
^2+2a
n
"Sa
n+1
_
0SSqStart_
6SSqEnd_
0.01Sa
0
_
DispSeqTbl_
Pause_
DrawSeqCon
Result screen:
1205
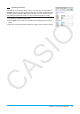
Program:
{0.5,1.2,2.4,4,5.2}Slist1_
{–2.1,0.3,1.5,2,2.4}Slist2_
StatGraph䡺1, On, Scatter, list1,
list2, 1, Square_
DrawStat
Result screen:
1206
Program:
{0.5,1.2,2.4,4,5.2}Slist1_
{–2.1,0.3,1.5,2,2.4}Slist2_
StatGraph䡺1, On, LogR, list1,
list2, 1_
DrawStat
Result screen:
LY777Ex_E.indb 39 13/02/25 11:24