
User Manual


Table Of Contents
- Table des matières
- Chapitre 1 : Bases
- Chapitre 2 : Application Principale
- 2-1 Calculs de base
- 2-2 Emploi de l’historique des calculs
- 2-3 Calculs de fonctions
- 2-4 Calculs de listes
- 2-5 Calculs de matrices et de vecteurs
- 2-6 Spécification d’une base numérique
- 2-7 Emploi du menu Action
- 2-8 Emploi du menu Interactif
- 2-9 Emploi de l’application Principale en combinaison avec d’autres applications
- 2-10 Utilisation de la fonction Vérifier
- 2-11 Emploi de Probabilité
- 2-12 Exécution d’un programme dans l’application Principale
- Chapitre 3 : Application Graphe & Table
- Chapitre 4 : Application Coniques
- Chapitre 5 : Application Graphes d’équations différentielles
- 5-1 Représentation graphique d’une équation différentielle
- 5-2 Tracé de graphes d’une fonction de type f(x) et de graphes d’une fonction paramétrique
- 5-3 Visualisation des coordonnées d’un graphe
- 5-4 Représentation graphique d’une expression ou valeur en la déposant dans la fenêtre graphique d’équation différentielle
- Chapitre 6 : Application Suites
- Chapitre 7 : Application Statistiques
- Chapitre 8 : Application Géométrie
- Chapitre 9 : Application Résolution numérique
- Chapitre 10 : Application eActivity
- Chapitre 11 : Application Finances
- Chapitre 12 : Application Programme
- Chapitre 13 : Application Spreadsheet
- Chapitre 14 : Application Graphe 3D
- Chapitre 15 : Application Plot Image
- Chapitre 16 : Application Calcul différentiel interactif
- Chapitre 17 : Application Physium
- Chapitre 18 : Application Système
- Chapitre 19 : Communication de données
- Appendice
- Mode Examen
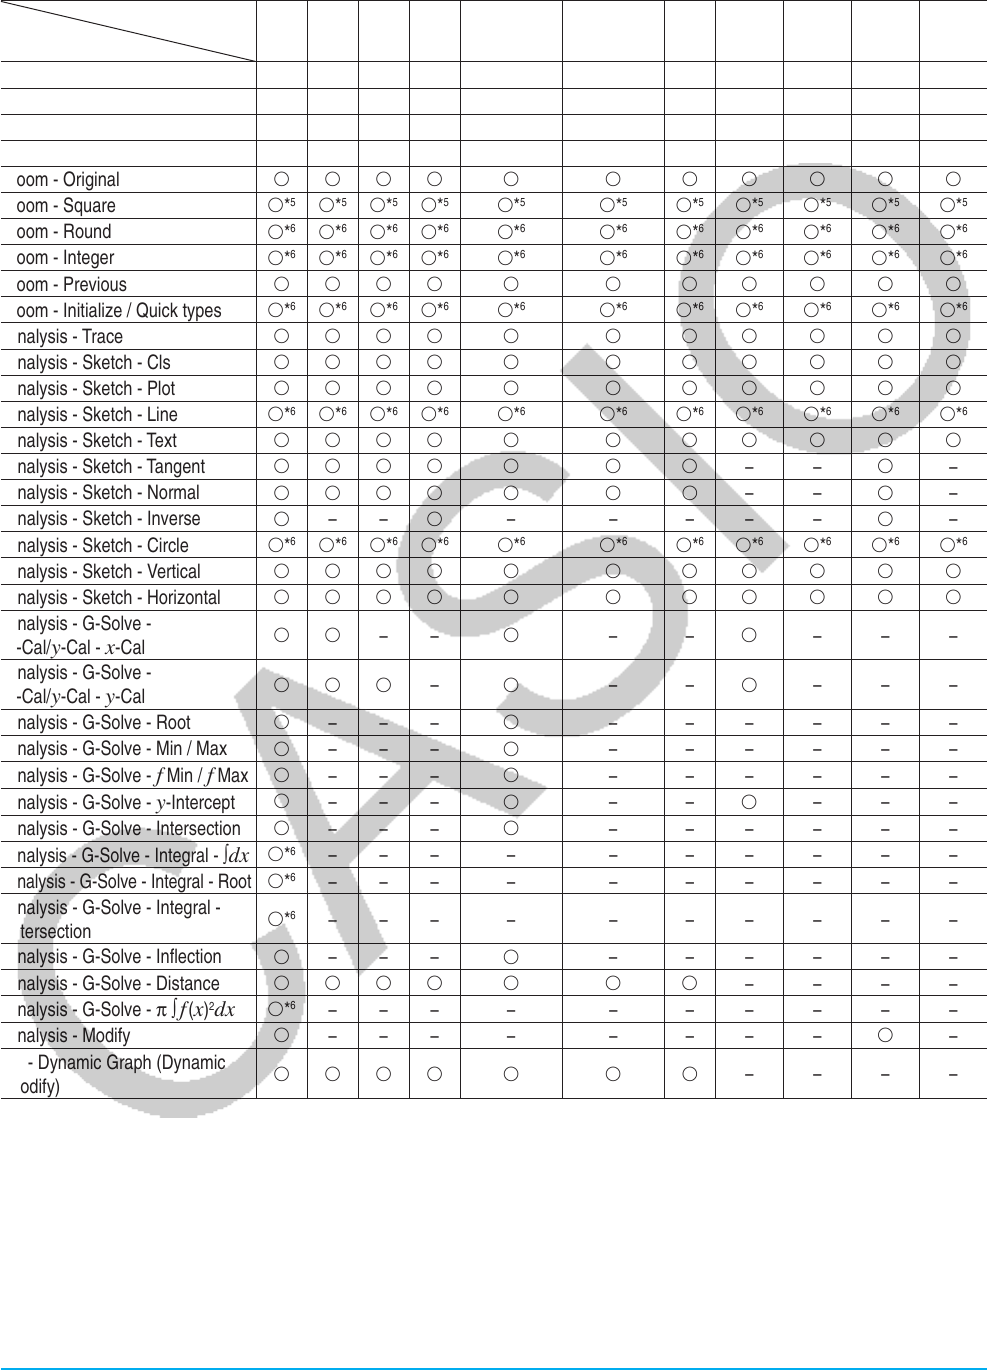
Appendice 314
Types de graphes et fonctions exécutables
䊊 : Exécutable − : Non exécutable
Type de graphe
Fonction
y= r= xt= x= y Inequality x Inequality y䉬
Conics*
1
Stat -
Plot*
2
Stat -
Reg*
3
Stat -
Box*
4
Zoom - Box
䊊䊊䊊䊊 䊊 䊊 䊊 䊊 䊊 䊊 䊊
Zoom - In
䊊䊊䊊䊊 䊊 䊊 䊊 䊊 䊊 䊊 䊊
Zoom - Out
䊊䊊䊊䊊 䊊 䊊 䊊 䊊 䊊 䊊 䊊
Zoom - Auto
䊊䊊䊊䊊 䊊 䊊 䊊 䊊
−−−
Zoom - Original
䊊䊊䊊䊊 䊊 䊊 䊊 䊊 䊊 䊊 䊊
Zoom - Square
䊊*
5
䊊*
5
䊊*
5
䊊*
5
䊊*
5
䊊*
5
䊊*
5
䊊*
5
䊊*
5
䊊*
5
䊊*
5
Zoom - Round
䊊*
6
䊊*
6
䊊*
6
䊊*
6
䊊*
6
䊊*
6
䊊*
6
䊊*
6
䊊*
6
䊊*
6
䊊*
6
Zoom - Integer
䊊*
6
䊊*
6
䊊*
6
䊊*
6
䊊*
6
䊊*
6
䊊*
6
䊊*
6
䊊*
6
䊊*
6
䊊*
6
Zoom - Previous
䊊䊊䊊䊊 䊊 䊊 䊊 䊊 䊊 䊊 䊊
Zoom - Initialize / Quick types
䊊*
6
䊊*
6
䊊*
6
䊊*
6
䊊*
6
䊊*
6
䊊*
6
䊊*
6
䊊*
6
䊊*
6
䊊*
6
Analysis - Trace
䊊䊊䊊䊊 䊊 䊊 䊊 䊊 䊊 䊊 䊊
Analysis - Sketch - Cls
䊊䊊䊊䊊 䊊 䊊 䊊 䊊 䊊 䊊 䊊
Analysis - Sketch - Plot
䊊䊊䊊䊊 䊊 䊊 䊊 䊊 䊊 䊊 䊊
Analysis - Sketch - Line
䊊*
6
䊊*
6
䊊*
6
䊊*
6
䊊*
6
䊊*
6
䊊*
6
䊊*
6
䊊*
6
䊊*
6
䊊*
6
Analysis - Sketch - Text
䊊䊊䊊䊊 䊊 䊊 䊊 䊊 䊊 䊊 䊊
Analysis - Sketch - Tangent
䊊䊊䊊䊊 䊊 䊊 䊊
−−
䊊
−
Analysis - Sketch - Normal
䊊䊊䊊䊊 䊊 䊊 䊊
−−
䊊
−
Analysis - Sketch - Inverse
䊊
−−
䊊
−−−−−
䊊
−
Analysis - Sketch - Circle
䊊*
6
䊊*
6
䊊*
6
䊊*
6
䊊*
6
䊊*
6
䊊*
6
䊊*
6
䊊*
6
䊊*
6
䊊*
6
Analysis - Sketch - Vertical
䊊䊊䊊䊊 䊊 䊊 䊊 䊊 䊊 䊊 䊊
Analysis - Sketch - Horizontal
䊊䊊䊊䊊 䊊 䊊 䊊 䊊 䊊 䊊 䊊
Analysis - G-Solve -
x-Cal/y-Cal - x-Cal
䊊䊊
−−
䊊
−−
䊊
−−−
Analysis - G-Solve -
x-Cal/y-Cal - y-Cal
䊊䊊䊊
−
䊊
−−
䊊
−−−
Analysis - G-Solve - Root
䊊
−−−
䊊
− −−−−−
Analysis - G-Solve - Min / Max
䊊
−−−
䊊
− −−−−−
Analysis - G-Solve -
f Min / f Max
䊊
−−−
䊊
− −−−−−
Analysis - G-Solve -
y-Intercept
䊊
−−−
䊊
−−
䊊
−−−
Analysis - G-Solve - Intersection
䊊
−−−
䊊
− −−−−−
Analysis - G-Solve - Integral - ∫dx
䊊*
6
−−− − − − − − − −
Analysis - G-Solve - Integral - Root
䊊*
6
−−− − − − − − − −
Analysis - G-Solve - Integral -
Intersection
䊊*
6
−−− − − − − − − −
Analysis - G-Solve - Inflection
䊊
−−−
䊊
− −−−−−
Analysis - G-Solve - Distance
䊊䊊䊊䊊 䊊 䊊 䊊
−−−−
Analysis - G-Solve - π ∫
f (x)
2
dx
䊊*
6
−−− − − − − − − −
Analysis - Modify
䊊
−−− − − − − −
䊊
−
䉬 - Dynamic Graph (Dynamic
Modify)
䊊䊊䊊䊊 䊊 䊊 䊊
−−−−
*1 Les commandes spéciales G-Solve de coniques ci-dessous peuvent être utilisées lors de la représentation graphique d’une conique.
Focus, Vertex, Directrix, Symmetry, Latus Rectum Length, Center, Radius, Asymptotes, Eccentricity,
x-Intercept
*2 Les graphes statistiques suivants : Scatter, Histogram,
xyLine, Broken, NPPlot
*3 Les graphes statistiques suivants : NDist, LinearR, MedMed, QuadR, CubicR, QuartR, LogR, ExpR, abExpR, PowerR, SinR,
LogisticR
*4 Les graphes statistiques suivants : MedBox, ModBox
*5 Ne peuvent pas être exécutés pendant une représentation graphique semi-log (quand le graphe est tracé avec seulement la case
x-log ou la case y-log cochée sur la boîte de dialogue de la fenêtre d’affichage).