
User Manual

Chapter 14: 3D Graph Application 250
Chapter 14:
3D Graph Application
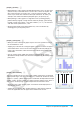
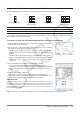
The 3D Graph application lets you draw a 3-dimensional graph of an
equation in the form z = f (x, y) or of a parametric equation.
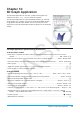
The 3D Graph application has a 3D Graph Editor window (1) and a 3D
Graph window (2). Functions you input on the 3D Graph Editor window
are graphed on the 3D Graph window. You can select any one of the
expressions on the 3D Graph Editor window and graph it on the 3D Graph
window.
1
2
3D Graph Application-Specific Menus and Buttons
3D Graph Editor window
• Delete text in a selected area. When nothing is selected, deleted the entire line where the cursor is
located. .........................................................................................................................Edit - Delete or q
• Return the current sheet to its initial default name (Sheet 1 through Sheet 5) ............. Sheet - Default Name
• Return the contents and name of the currently active sheet to their initial defaults ......... Sheet - Clear Sheet
• Draw a graph ............................................................................................................................................. 7
• Toggle the equation type between
z = f (x, y) and a parametric equation ..........................................x / z
• Insert variable s or t into a parametric equation .................................................................................s / [
3D Graph window
• View the displayed graph from the x-axis, y-axis, or z-axis ............................. Zoom - View-x, View-y, View-z
• Return View Window settings and zoom settings to their initial defaults ...............................Zoom - View-Init
• Make the 3D Graph Editor window active ...................................................................................................Z
• Display the coordinates at a particular point on a 3D graph ........................................Analysis - Trace or =
• Write text on the Graph window ................................................................................. Analysis - Sketch - Text
• Clear text on the Graph window ...................................................................................Analysis - Sketch - Cls
• Calculate a
z-value for given x- and y-values, or s- and t-values, on the displayed graph ...... Analysis - z-Cal
• Automatically rotate a graph in the specified direction (Left → Right, Right → Left, Top → Bottom,
Bottom → Top) for about 30 seconds ....................................................................................a - Rotating
• Re-draw a graph ......................................................................................................................... a - ReDraw
• Show/hide axes and labels .........................................................................................................................q