
User Manual


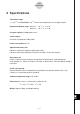


Table Of Contents
- Getting Ready
- Contents
- About This User’s Guide
- Chapter 1 Getting Acquainted
- Chapter 2 Using the Main Application
- 2-1 Main Application Overview
- 2-2 Basic Calculations
- 2-3 Using the Calculation History
- 2-4 Function Calculations
- 2-5 List Calculations
- 2-6 Matrix and Vector Calculations
- 2-7 Using the Action Menu
- 2-8 Using the Interactive Menu
- 2-9 Using the Main Application in Combination with Other Applications
- 2-10 Using Verify
- Chapter 3 Using the Graph & Table Application
- Chapter 4 Using the Conics Application
- Chapter 5 Using the 3D Graph Application
- Chapter 6 Using the Sequence Application
- Chapter 7 Using the Statistics Application
- 7-1 Statistics Application Overview
- 7-2 Using List Editor
- 7-3 Before Trying to Draw a Statistical Graph
- 7-4 Graphing Single-Variable Statistical Data
- 7-5 Graphing Paired-Variable Statistical Data
- 7-6 Using the Statistical Graph Window Toolbar
- 7-7 Performing Statistical Calculations
- 7-8 Test, Confidence Interval, and Distribution Calculations
- 7-9 Tests
- 7-10 Confidence Intervals
- 7-11 Distribution
- 7-12 Statistical System Variables
- Chapter 8 Using the Geometry Application
- Chapter 9 Using the Numeric Solver Application
- Chapter 10 Using the eActivity Application
- Chapter 11 Using the Presentation Application
- Chapter 12 Using the Program Application
- Chapter 13 Using the Spreadsheet Application
- Chapter 14 Using the Setup Menu
- Chapter 15 Configuring System Settings
- 15-1 System Setting Overview
- 15-2 Managing Memory Usage
- 15-3 Using the Reset Dialog Box
- 15-4 Initializing Your ClassPad
- 15-5 Adjusting Display Contrast
- 15-6 Configuring Power Properties
- 15-7 Specifying the Display Language
- 15-8 Specifying the Font Set
- 15-9 Specifying the Alphabetic Keyboard Arrangement
- 15-10 Optimizing “Flash ROM”
- 15-11 Specifying the Ending Screen Image
- 15-12 Adjusting Touch Panel Alignment
- 15-13 Viewing Version Information
- Chapter 16 Performing Data Communication
- Appendix

20050501
4 Number of Digits and Precision
k Number of Digits
Standard Mode
The following applies when the check box next to the “Decimal Calculation” item on the
Basic Format dialog box is not selected.
•Up to 611 digits are stored in memory for integer values.
•Decimal values up to 15 digits are converted to fraction format and saved in memory. When
a mathematical expression cannot be converted to fraction format, the result is displayed in
decimal format.
•Values stored in memory are displayed as-is, regardless of how [Display] settings
(Normal 1, Normal 2, Fix 0 – 9, Sci 0 – 9) are configured (except when a decimal value is
displayed).
Decimal Mode
The following applies when the check box next to the “Decimal Calculation” item on the
Basic Format dialog box is selected.
•Values stored in Ans memory have the same number of digits as they have when
displayed. A value that is assigned to a variable has the same number of digits as defined
for Standard mode values.
•Values are displayed in accordance with how [Display] settings (Normal 1, Normal 2,
Fix 0 – 9, Sci 0 – 9) are configured.
•Displayed values are rounded to the appropriate number of decimal places.
•Some applications store values using a mantissa up to 15 digits long and a 3-digit
exponent.
k Precision
• Internal calculations are performed using 15 digits.
• The error for a single mathematical expression (Decimal mode calculation error) is ±1 at
the 10th digit. In the case of exponential display, calculation error is ±1 at the least
significant digit. Note that performing consecutive calculations causes error to be
cumulative. Error is also cumulative for internal consecutive calculations performed for:
^(x
y
),
x
, x!, nPr, nCr, etc.
•Error is cumulative and tends to be larger in the vicinity of a function’s singular point(s) and
inflection point(s), and the vicinity of zero. With sinh(x) and tanh(x), for example, the
inflection point occurs when x = 0. In this vicinity, error is cumulative and precision is poor.
α
-4-1
Number of Digits and Precision