
User Manual
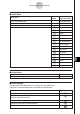


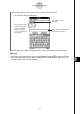
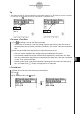


Table Of Contents
- Getting Ready
- Contents
- About This User’s Guide
- Chapter 1 Getting Acquainted
- Chapter 2 Using the Main Application
- 2-1 Main Application Overview
- 2-2 Basic Calculations
- 2-3 Using the Calculation History
- 2-4 Function Calculations
- 2-5 List Calculations
- 2-6 Matrix and Vector Calculations
- 2-7 Using the Action Menu
- 2-8 Using the Interactive Menu
- 2-9 Using the Main Application in Combination with Other Applications
- 2-10 Using Verify
- Chapter 3 Using the Graph & Table Application
- Chapter 4 Using the Conics Application
- Chapter 5 Using the 3D Graph Application
- Chapter 6 Using the Sequence Application
- Chapter 7 Using the Statistics Application
- 7-1 Statistics Application Overview
- 7-2 Using List Editor
- 7-3 Before Trying to Draw a Statistical Graph
- 7-4 Graphing Single-Variable Statistical Data
- 7-5 Graphing Paired-Variable Statistical Data
- 7-6 Using the Statistical Graph Window Toolbar
- 7-7 Performing Statistical Calculations
- 7-8 Test, Confidence Interval, and Distribution Calculations
- 7-9 Tests
- 7-10 Confidence Intervals
- 7-11 Distribution
- 7-12 Statistical System Variables
- Chapter 8 Using the Geometry Application
- Chapter 9 Using the Numeric Solver Application
- Chapter 10 Using the eActivity Application
- Chapter 11 Using the Presentation Application
- Chapter 12 Using the Program Application
- Chapter 13 Using the Spreadsheet Application
- Chapter 14 Using the Setup Menu
- Chapter 15 Configuring System Settings
- 15-1 System Setting Overview
- 15-2 Managing Memory Usage
- 15-3 Using the Reset Dialog Box
- 15-4 Initializing Your ClassPad
- 15-5 Adjusting Display Contrast
- 15-6 Configuring Power Properties
- 15-7 Specifying the Display Language
- 15-8 Specifying the Font Set
- 15-9 Specifying the Alphabetic Keyboard Arrangement
- 15-10 Optimizing “Flash ROM”
- 15-11 Specifying the Ending Screen Image
- 15-12 Adjusting Touch Panel Alignment
- 15-13 Viewing Version Information
- Chapter 16 Performing Data Communication
- Appendix
20050501
10-3 Inserting Data into an eActivity
The following describes the four types of data you can insert into an eActivity.
10-3-1
Inserting Data into an eActivity
Inserting a Text Row
Text rows make it possible to display and edit text directly in the eActivity window. Text rows
can contain multiple lines, as well as mathematical expressions. A mathematical expression
contained in a text row is not evaluated. Pressing E, while in the Text Input mode, will
advance you to the next line without displaying results. Individual text rows can scroll
horizontally, but not vertically. The entire eActivity page can be scrolled vertically.
Tip
•You can also use the ) soft keyboard to input mathematical expressions into a text row.
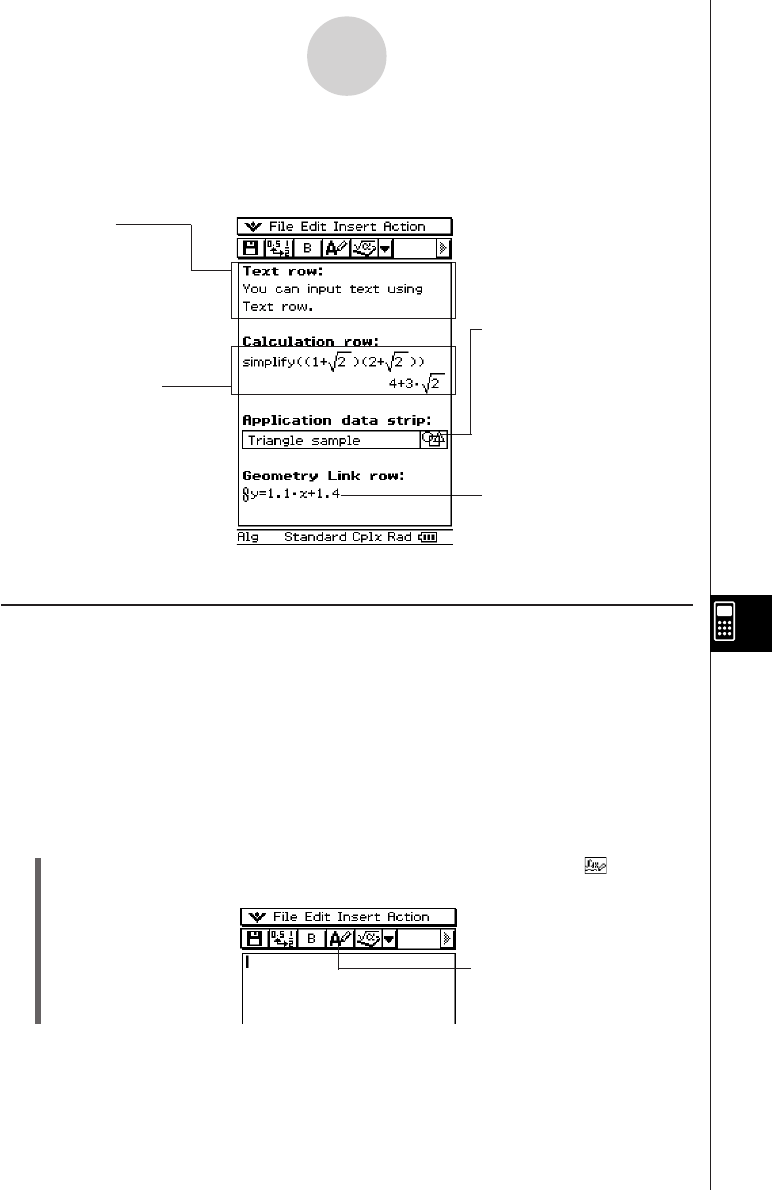
u To select the input mode
(1) On the eActivity window toolbar, tap the fourth button from the left (u / ) to toggle
the input mode between Text Input and Calculation Input.
Geometry Link Row
Use this row to insert data
that is linked with a Geometry
window figure.
Text Row
A text row can be
used to insert text
data and
mathematical
expression text in
natural format. You
can also bold the text
in a text row.
Calculation Row
Use the calculation row
to insert any of the
calculation operations
that are available in the
Main application.
Application data strip
The application data strip lets
you display a window from a
ClassPad application (Main,
Graph & Table, Geometry, etc.)
and use the window to create
data, which is inserted into the
eActivity.
u button indicates the Text Input
mode is selected.